


Who Really Owns The U.S. Housing Market? The Complete Roadmap
Is BlackRock really buying up all of the single-family homes in America? How involved is Blackstone? Are private equity firms and big investors taking over the housing market? Are “build-to-rent” communities becoming a trend? Are foreigners buying up U.S. residential properties? Who owns all of the vacation rentals, manufactured home communities, and student housing? Are we really going to own nothing and be happy?
Whether you are looking to buy, sell, rent, invest, relocate, or just want to keep your eye on the ball, this report will act as a roadmap, showing where individuals, mom-and-pop investors and large investors monopolize different sectors of the housing industry and where the hot locations are. It is packed with hundreds of statistics and charts to provide both context and visual aids for a comprehensive view of how the landscape of America is shifting. There have been some big misconceptions and many of these statistics will surprise people.
The Complete Roadmap:
• Single-Family Homes and The Rental Market: Homeowners Versus Investors
• The Top 6 Companies That Own Single-Family Home Rentals
• Build-To-Rent Single-Family Home Communities
• Foreign-Owned U.S. Residential Property
• Manufactured Housing Communities
• Vacation Rental Homes Market
• Student Housing Market
• The Affordable Housing Scheme
• Private Equity and Large Investors
• The Biggest Takeaways
Download this full report in The Bookshop >
Increased mortgage rates that have reached as high as 7.79%, coupled with increased homeowners insurance, property taxes, utility bills, and the darn silverware in the kitchen drawers, has made it extremely difficult for people to afford homes. One of the bigger trends is build-to-rent communities. In fact, many private equity firms, real estate management companies and developers have been selling off inventory of single-family homes while the market has been hot and using the capital to expand on these communities. But make no mistake, there is also a growing trend of buying homes for cash and converting them to rentals. Is it the mega investors, the mom-and-pops or the small-to medium-sized management companies, and where do the shareholders fit into this action?
It’s important to cut through the fog and get down to specifics while comparing homeowners versus small investors, flippers, and mega investors to see where this housing market sits and where it’s headed. The reality is that individual homeowners own the majority of the single-family market and there are a lot of data points that will surprise people. There is also opportunity for individuals and mom-and-pop investors. However, private equity firms pretty much have their claws dug in to every sector of the housing industry from single-family homes to manufactured housing communities and student housing.
There are numbers flying all over the place and it’s not an apples-to-apples comparison by any means because numerous sources use mixed terms without specifying precisely the type of dwelling the numbers represent. Oftentimes, the percentages for investors’ stakes are reduced by lumping data on specific dwellings into the overall housing units market. In addition to this, certain data is only available up to 2022, where other data is current through first quarter 2024. Another big hiccup is that there is no universal definition of “institutional investor,” so multiple data sources will state numbers and percentages based on what they deem to be an institutional investor. For example, some break it up based on 1-10 homes being a small investor and mega investors own more than 1,000, while others will report numbers based on large investors owning more than 100 homes. And, there are also short-term and long-term investors, which obviously makes a huge difference in the grand scheme of things. Furthermore, most don’t dig deep enough to get a realistic picture of who the actual owners are. The data is inconsistent across the board, so comparisons and scrutiny are necessary when pulling data points.
After doing an immense amount of cross referencing, digging into dozens of data points, and running the math to get to the bottom of the actual numbers, this report reveals where homeowners, small investors and mega investors stand in the entire U.S. housing market.
Definitions for clarity:
• Single-Family Homes: include fully detached homes and semi-detached which are side-by-side dwellings making up row houses, duplexes, quadruplexes, and townhouses. If there are units above or below, they are not separate by a ground-to-roof wall, or they have shared meters for utilities they are considered multifamily.
• Multifamily Units: residential buildings containing units built one on top of another and those built side-by-side which do not have a ground-to-roof wall and/or have common facilities such as attic, basement, plumbing, etc. Townhouses and condominiums that do not meet the definition of single-family homes fall under multifamily. Typically, multifamily buildings consist of 5 units or more, but a single structure with 2-4 units can also be considered multifamily if it meets the criteria. Example: of the 450,000 completed multifamily units in 2023, only 12,000 were 2-4 units, 206,000 made up 5-49 units and 233,000 were buildings with over 50 units, with the largest volume built in the South.
• Housing Units: include all single-family detached and semi-detached homes, all multifamily such as apartments, a group of rooms, condos, prefabricated and modular units, mobile homes, and units in assisted living facilities. Excluded from statistics are: dormitories and rooming housing, barracks, transient hotels unless permanent resident, and nursing homes.
Single-Family Homes and The Rental Market: Homeowners Versus Investors
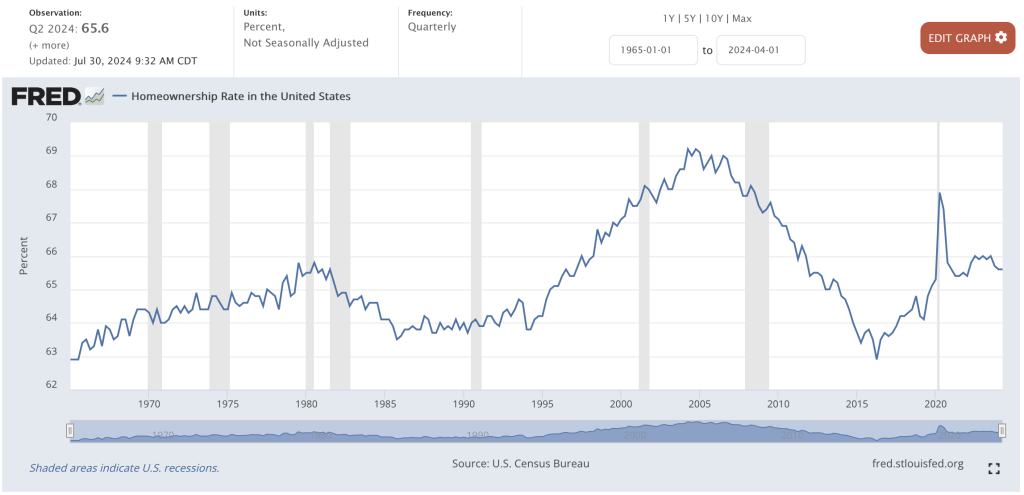
Homeownership rate has toggled between 62.9% and 69.2% from 1965 to April 30, 2024 where it sits at 65.6%.
As of 2022, 39.28% of homeowners own their homes outright and do not carry a mortgage, which is a 6.5% increase since 2010. Again, nearly 40% of homeowners own their homes outright and are mortgage-free! 38% of all homeowners are baby boomers so many have probably lived in their homes for a long time and paid off their mortgage, and some “homeowners” are investors who often don’t carry a mortgage. Nonetheless, it’s an impressive percentage.
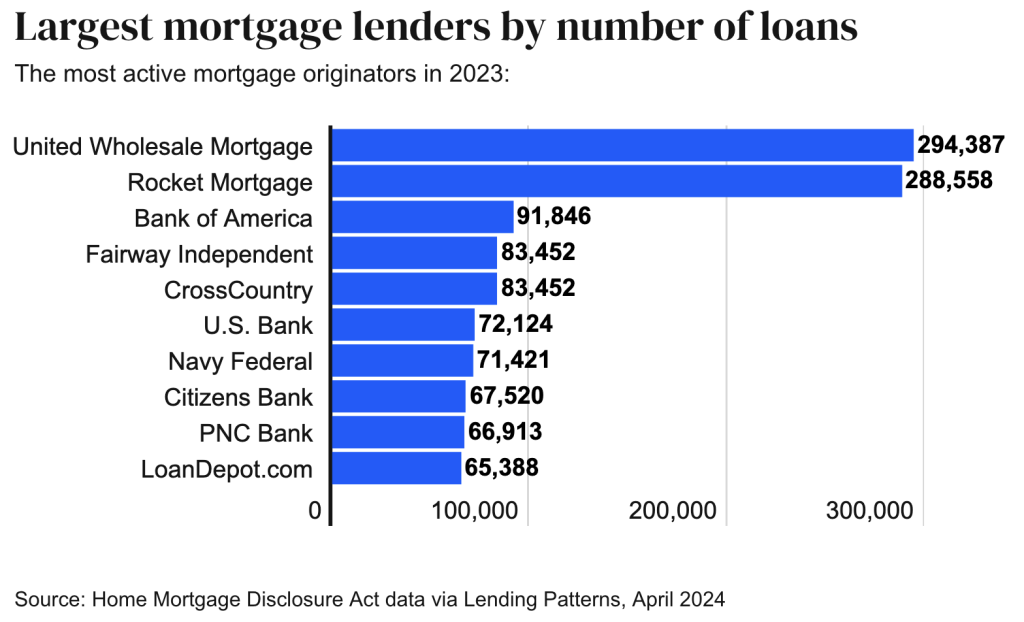
For those who don’t own their homes outright, the largest mortgage originators by number of loans as of 2023 are United Wholesale Mortgage, Rocket Mortgage, Bank of America, Fairway Independent, CrossCountry, U.S. Bank, Navy Federal, Citizens Bank, PNC Bank, and LoanDepot.
Who are the top shareholders of the top three largest mortgage lenders in the U.S.?
The top shareholders of United Wholesale Mortgage (UWM Holdings Corp) are Vanguard, Fidelity, Platinum Equity Advisors, BlackRock, and Northern Trust Corp.
The top shareholders of Rocket Mortgage (Rocket Companies, Inc.) are Vanguard, Fidelity, Boston Partners, JP Morgan Chase & Co, and BlackRock.
The top shareholders of Bank of America are Berkshire Hathaway, Vanguard, BlackRock, State Street Corp, and Fidelity.
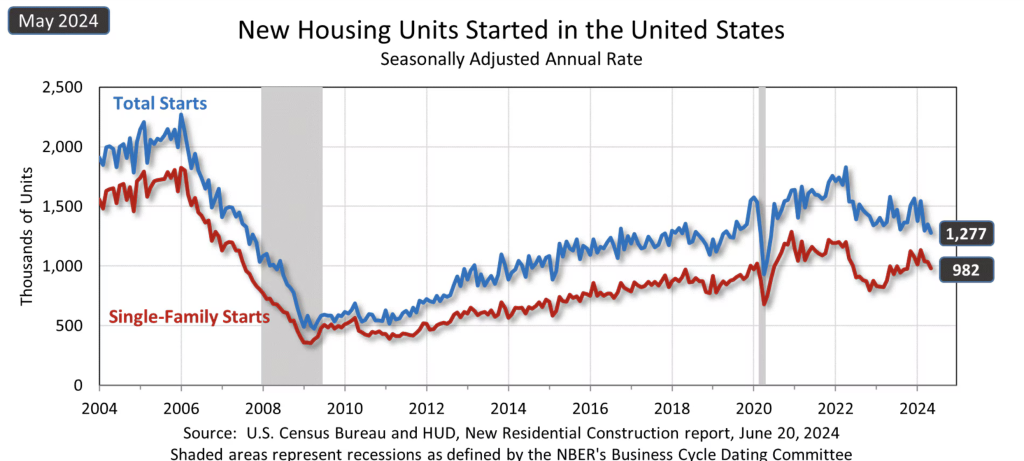
New housing builds have been on a steady increase since 2010, with a slight dip in 2022-2023. On average, there are close to 1.5 million house starts annually, with roughly 65% accounting for single-family homes.
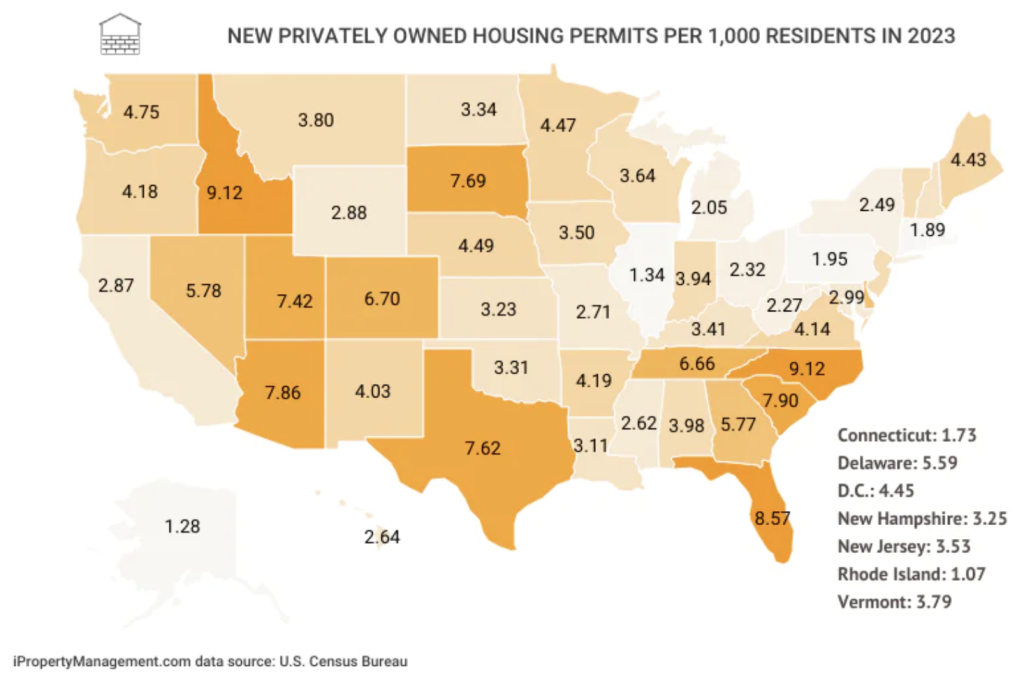
In 2023, North Carolina had the largest number of privately owned housing permits per 1,000 residents, while Idaho, Florida, Arizona, South Dakota, and Texas saw good activity as well.
According to a May, 2024 release by the U.S. Census Bureau, Population Division on annual estimates of housing units for the United States, Regions, States, and the District of Columbia, there were 145.4 million housing units in the U.S., which was updated to 146.6 million in Q2 2024.
U.S. Housing:
Housing Units: 146,640,000
Occupied: 131,414,000
Owner occupied: 86,259,000
Renter occupied: 45,155,000
Vacant: 15,227,000
Approximate Housing Inventory:
90 million single-family detached homes
9 million single-family attached homes
23 million apartment units – 39% are 2-bedroom units & 87.2% of new apts. are built with 20+ units
17 million duplex, condos, townhomes and other multifamily units that consist of 2-9 unit structures
8 million manufactured and mobile homes
Vacancy Breakdown:
11,776,00 year-round – 3,451,000 seasonal
Over 8 million are single-family attached and detached
Over 5 million are apartments
Over 1 million are manufactured and mobile homes
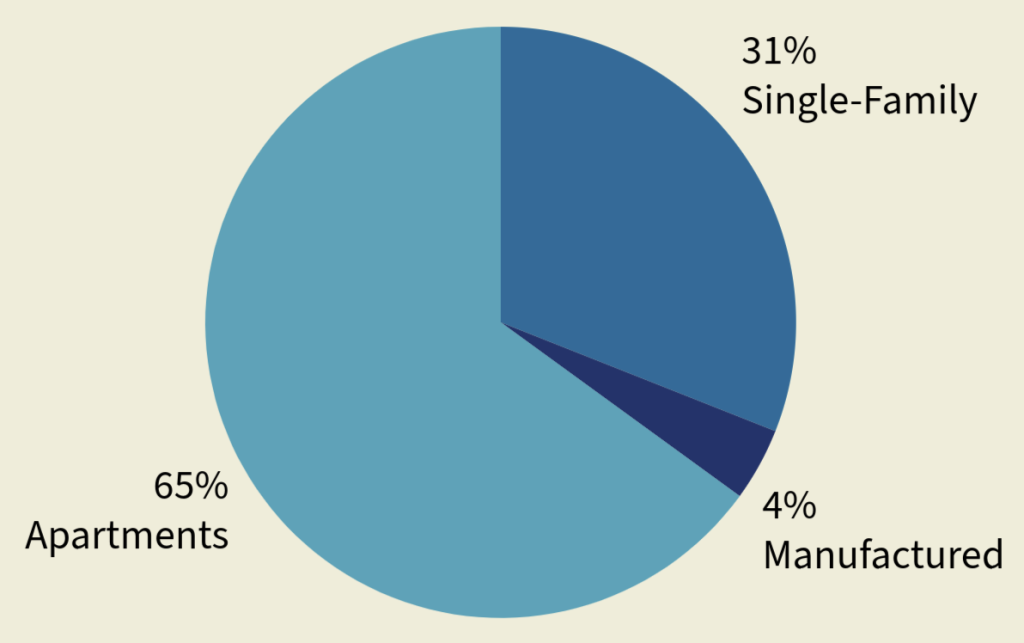
Rental Housing Share from 2023 figures:
65% (29 million) apartments in multifamily buildings
31% (14 million) single-family attached and detached homes
4% (2 million) manufactured and mobile homes
So who owns all of the single-family homes?
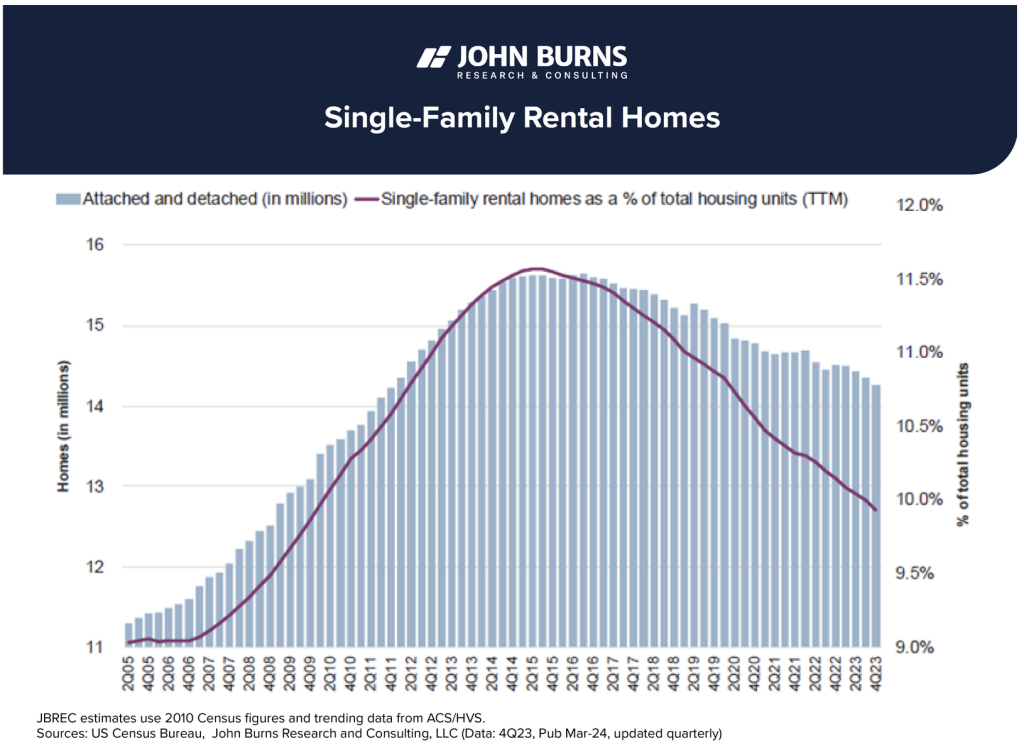
According to John Burns Research & Consulting, investors (including second-home buyers) own 14.3 million single-family rental homes of which 11.4 million are detached and 2.9 million are attached. Based on the 99 million figure pulled from the Census Bureau, that would account for 14.4% of the single-family housing market. However, John Burns’ chart indicates 9.9% to represent the percentage of single-family rental homes owned by investors from the overall housing unit stock in the U.S.
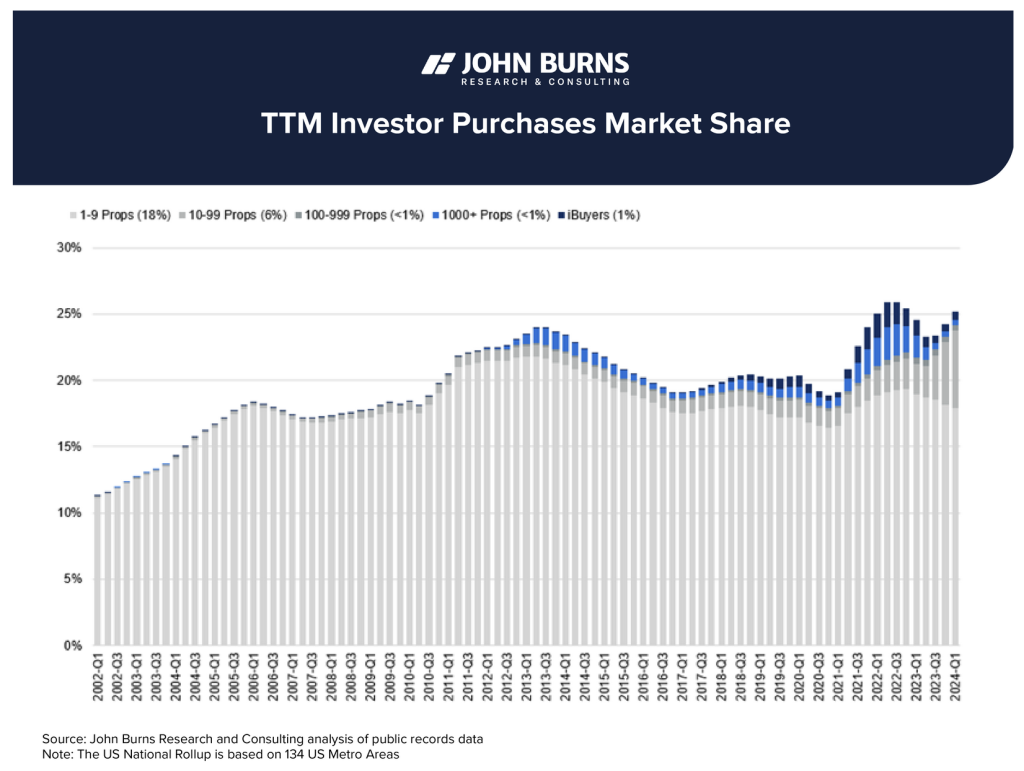
Burns’ data shows that investors are purchasing 25% of homes, which includes second-home buyers. The following chart illustrates that the largest sector of investors are the smaller mom-and-pops who own between 1-9 homes making up nearly 18%, followed by the investors with portfolios of 10-99 units who account for roughly 5%. Big institutional investors who own 100 or more homes are buying less than 2% of all homes. Many of the bigger investors are invested in the build-to-rent single-family home communities, as documented further down.
According to the National Association of Home Builders, the nation’s stock of second homes was at 6.5 million in 2022. Some of those folks rent their second home out, and therefore fall under the mom-and-pop category of the 14.3 million investors who own and rent single-family homes.
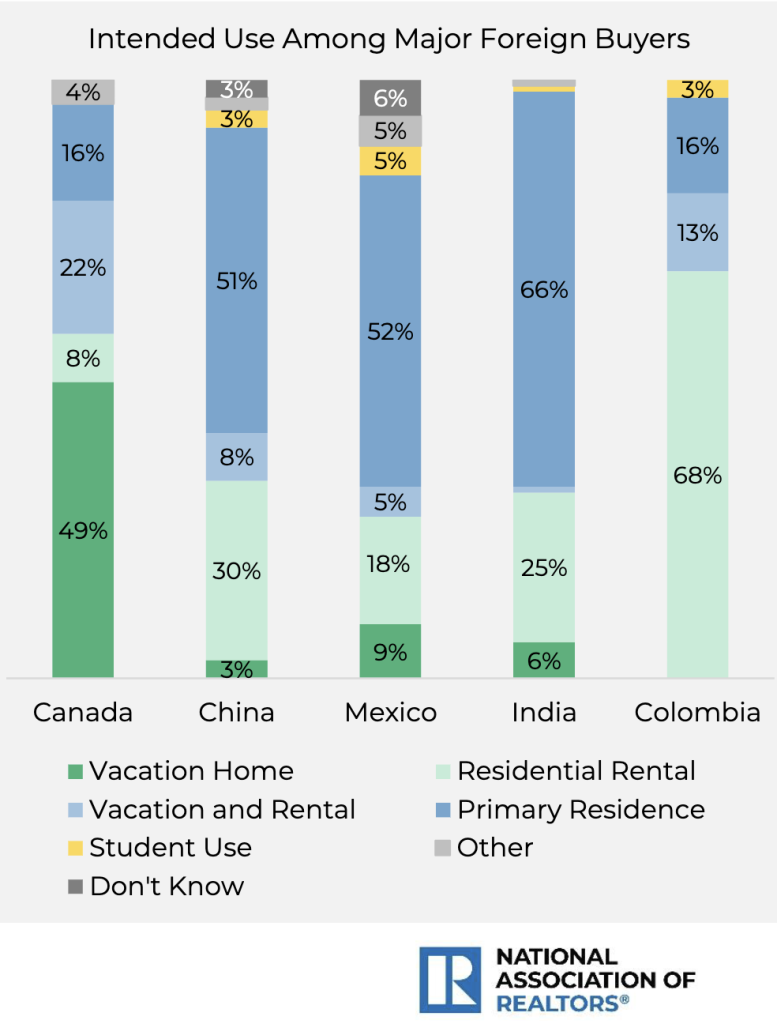
It’s also important to note that foreigners would also calculate into the single-family rental homes. Between April 2023 and March 2024, foreigners purchased 54,300 housing units in the U.S., of which 76% were a detached single-family home or townhome, the median purchase price was $475,000, and 45% use the property for a vacation home, rental, or both. The chart below just represents the top five foreign buyers. See the housing section further down for more details on foreign buyers of U.S. residential property.
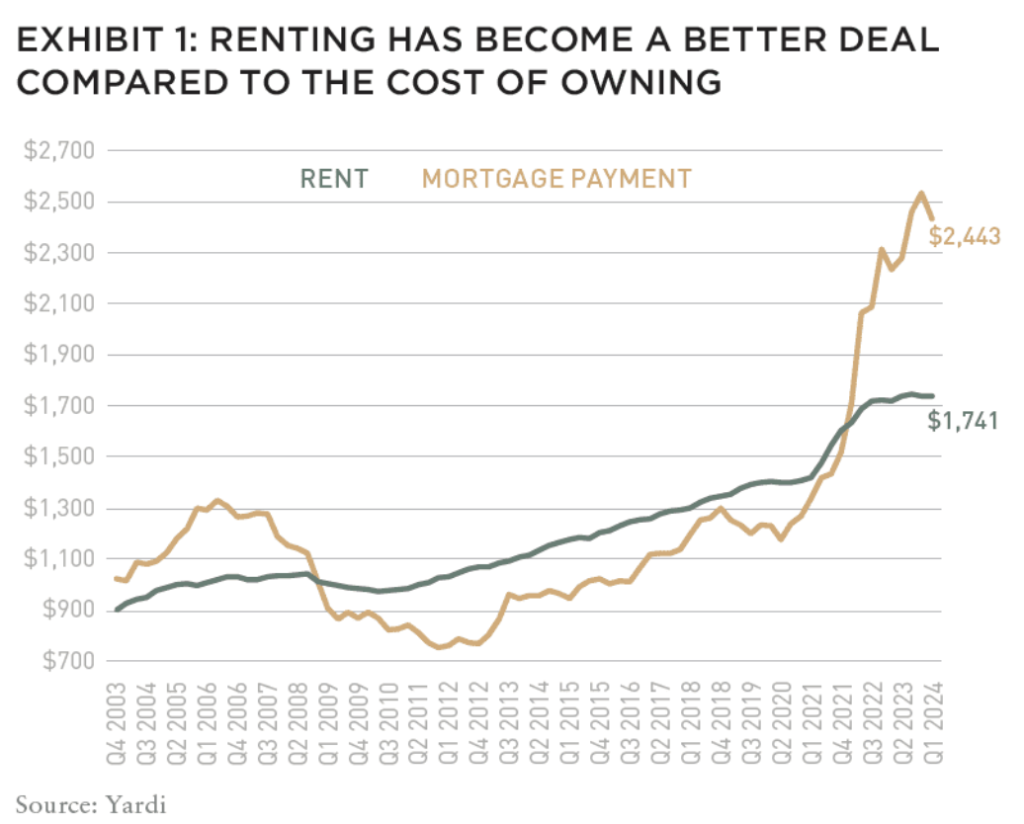
According to Yardi-Matrix, In July 2024, they indicated that the large investors owning over 100 single-family rental homes owned roughly 800,000 – less than 5% of all SFRs. Some other highlights Yardi reported on were that 163,000 units were in communities with fifty or more homes as of March 2024, the occupancy rate of SFR communities was higher than multifamily at 95.4% nationally, and that renting has become more affordable than a mortgage.
• In an Urban Institute report, as of June 2022, there were 46.6 million total rental properties with 15.1 million being one-unit properties (single-family) accounting for 32.4% of the total rental stock. They suggest that the total institutional investor ownership (those owning at least 100 single-family homes) owned 3.8% of the one-unit rentals nationwide. That makes sense since there was a big buying period and then many investors sold off homes when the price was right and invested in the build-to-rent sector.
• According to a 2024 first quarter home sales report by Realtor.com, investors accounted for 14.8% of home purchases, whereby 62.6% of those purchases were made by small investors (10 or fewer homes). Realtor reports that this is the highest small investor share since 2001 when they first began tracking the sales. The large percentages being thrown around in media on investor-owned homes, are percentages of “home sales” for a specific quarter, year, or geographic location, such as this report by Realtor, not the percentage of all single-family homes owned by investors. It’s also important to note that the word “investor” represents single individuals who purchase second homes as well. As one can see in this Realtor report, 62.6% of the 14.8% “investor purchases” were small investors who purchased between 1-9 homes, meaning just 5.5% of homes were purchased by investors who own 10+ homes, and many of those are likely homes that are being flipped, not rented.
• Single-family housing currently makes up 75% of land that is zoned for housing, but many local and state governments have been working on changing zoning laws to allow for smaller housing and multifamily housing to consume portions of that land. They are also aiming to create affordable housing developments. The National Association of Home Builders’ 10-point housing plan includes overturning local zoning rules, removing permitting roadblocks, relief from environmental and community review requirements, and to pass federal tax legislation that will help expand affordable housing.
• In the multifamily sector, such as apartments, the numbers on ownership are a bit fuzzy. There are currently 45.1 million total rental units in the U.S based on the Q2 2024 Census data, of which roughly 30-31 million would represent multifamily. According to the National Rental Home Council, institutional investors owned 55% of multifamily rental units as of 2018. Fast forward to May 2022, and Savills reported that the institutional investors accounted for 40%. In the apartment arena, Greystar has taken the lead over MAA in owning and/or managing more than one million units in the U.S. In 2023, the top five largest apartment owners were MAA, Greystar, Morgan Properties, AvalonBay Communities, and Equity Residential, with three of the five supported by BlackRock and Vanguard. Here is the full 2023 list of the top 50.
Multifamily unit starts have declined the first half of 2024 from much higher levels in 2022-2023. See Fannie Mae’s full 2024 report on the multifamily construction pipeline update.
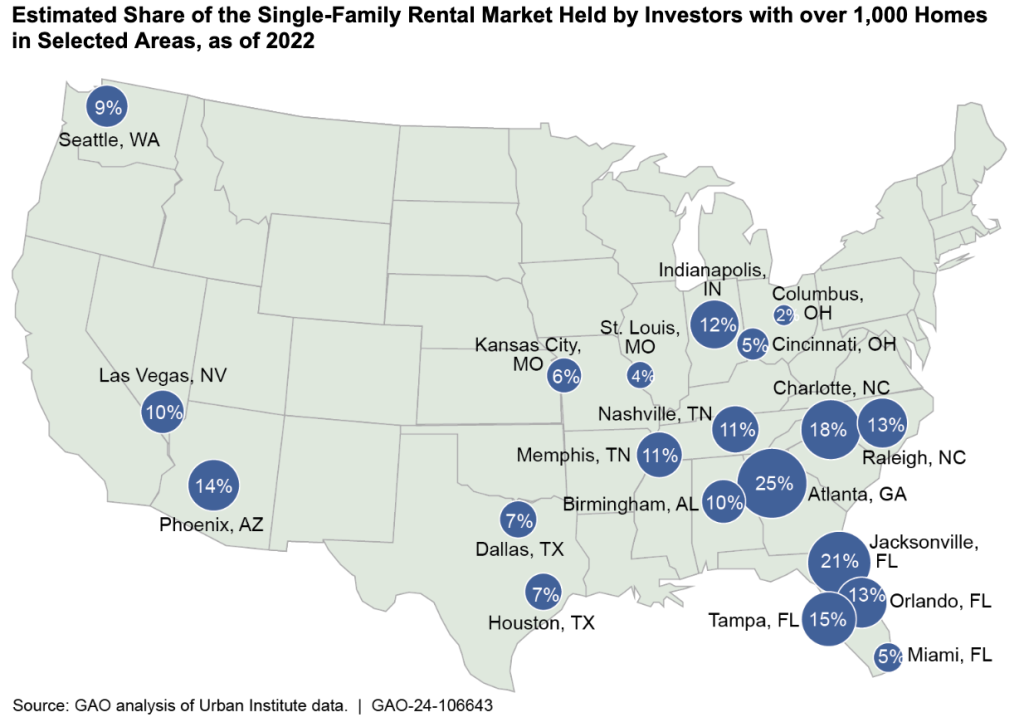
• The map by GAO below shows the hot spots that the mega investors in the single-family rental market are moving in on. Whereas the percentage across the country only equates to 2%, when isolating individual areas, one can see that number climb quickly.
• According to MetLife Investment Management, they believe that institutional investors could control 40% of the U.S. single-family rental home market by 2030. That would be an incredible increase from 800,000 homes, if they are referring to “institutional investors” as owning 100+ homes.
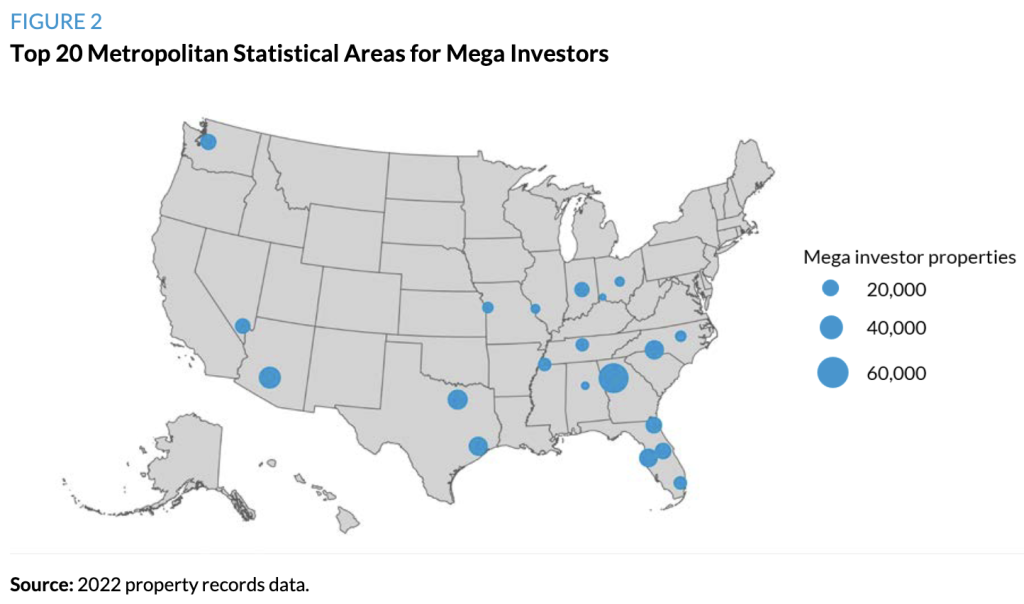
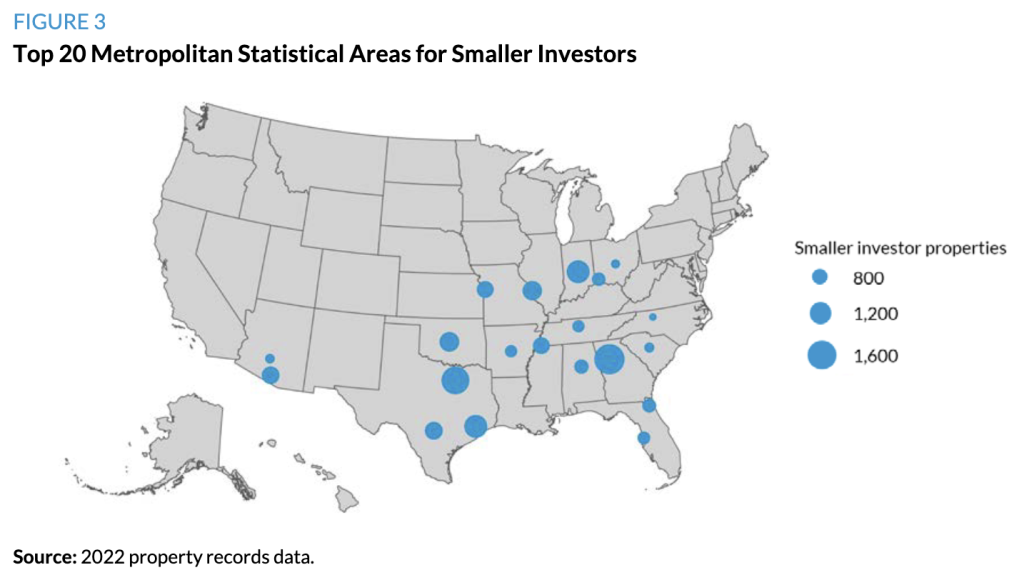
• The Urban Institute shows the top 20 locations where mega investors hold single-family rental homes versus where the smaller investors dominate, and several areas tend to overlap. These maps are based on 2022 records, but it’s pretty safe to bet that the locations are still prime for them.
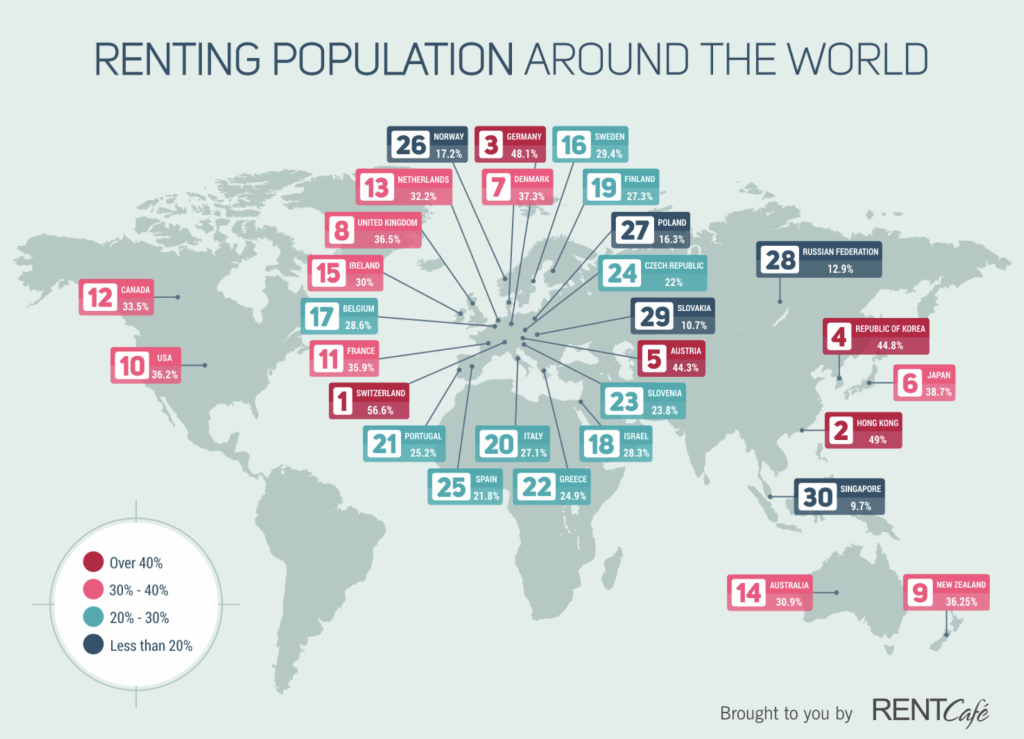
• In a 2018 international study, RentCafe analyzed 30 countries to determine the share of owning vs renting. They discovered that in 29 out of 30 countries the majority were homeowners, with exception of Switzerland where more than half of the population rents. This is a great map they put together, covering 30 countries, to show where the renting vs owning market stood back in 2018.
In 2018, 36.2% of Americans rented vs owned. As of April 2024, the rental rate dropped slightly to 34.4%.
In 2023, 2.5 million households moved to a single-family rental home, meaning they either moved from a multifamily unit, were first-time renters, or sold their homes and opted to rent a home. In a survey conducted by the U.S. Census Bureau, 14.3% stated they made the move because they wanted new or better housing, while 13.2% said it was for a job transfer and 10.9% wanted cheaper housing.
Since the percentage of renters actually dropped over the past six years, that survey would indicate that the market is likely shifting from multifamily to single-family rentals.
• Rent prices are increasing faster than home prices in two-thirds of the country, with an average investment return of 7.55% in 2024. Rents are also rising faster than wages in the majority of 341 counties that were analyzed by ATTOM. The interactive map created by ATTOM shows single-family rental returns in each of these counties, with some areas hitting in the teens.
Ownership Recap of Single-Family Homes:
• Investors own and rent 14.3 million single-family attached and detached homes
• Investors account for 14.4% of all single-family homes or 9.9% of all housing units in the U.S.
• Investors (including second-home buyers) are purchasing 25% of all homes sold
• Mom-and-Pops are leading the way (1-9 homes) – 18%
• Mid-Size Investors (10-99 homes) – 5%
• Big Institutional Investors (100+ homes) – 2%
• Big Institutional Investors currently own roughly 800,000 single-family rental homes
The Top 6 Companies That Own Single-Family Rental Homes In The U.S.
While individual homeowners account for the majority of single-family homes, investors of all sizes are purchasing 25% of single-family homes. Most of these investors are the mom-and-pops who own between 1-9 homes, but roughly 2% are big investors that own 100+ homes. Those are discussed in this section.
According to a 2024 report by the Government Accountability Office (GAO), based on a review of 74 studies regarding institutional investors in single-family rental housing, no single investor owned more than 1,000 single-family homes prior to 2011. (Side note: By 2013, Blackstone bought more than that in a single day for over $100 million.) That number skyrocketed to 170,000 – 300,000 homes owned by institutional investors by 2015, and by 2022, 32 institutional investors owned a combined 450,000 single-family homes, five of which accounted for 300,000 of those. The report emphasizes that even though the institutional investors only own 2% of the single-family rental stock, in some areas that percentage drastically increases, such as 25% of Atlanta, GA, 21% of Jacksonville, FL, and 18% of Charlotte, NC. Those are significant numbers.
GAO reported that there were 450,000 single-family rental homes owned by institutional investors as of 2022. However, in a report by the Urban Institute, they estimated that large institutional investors owned 574,000 single-family homes as of June 2022 and their report was also based on 32 institutional investors. But, the Urban Institute actually aggregated data on all legal entities of the parent company because these institutional owners often use other names as the owner. They based their report on large investors owning a minimum of 100 single-family homes and they pulled data from a national property records database. The 574,000 figure is likely more accurate than GAO’s and the difference is most likely due to aggregating all of the legal entities under the parent companies.
By 2024, the following top six owners of single-family rental homes corner the market, holding over 400,000 homes combined:
1) Progress Residential
Parent company: Pretium Partners
Private company
Number of homes: Over 100,000
2) Invitation Homes
Top shareholders: Vanguard, Cohen & Steers, BlackRock
Formed by Blackstone in 2012, went public in 2017, then sold its stake in 2019
Number of homes: Over 84,000
3) Tricon Residential and Home Partners of America
Parent company: Blackstone
Top shareholders: Vanguard, BlackRock, Capital World Investments
Number of homes: Over 62,000
4) AMH (American Homes 4 Rent)
Top shareholders: Vanguard, BlackRock, Norges Bank
Number of homes: Over 60,000
5) FirstKey Homes
Parent company: Cerberus Capital Management
Private company
Number of homes: Over 51,000
6) Amherst Group
Parent company: Amherst Holdings
Private company
Number of homes: Over 45,000
One example to show how this could impact an area would be what’s taken place in metro Atlanta. Almost 11% of the single-family rental market (over 19,000 homes) in metro Atlanta are homes that belong to Invitation Homes, Pretium Partners and Amherst Holdings. According to GSU professor Taylor Shelton and Rutgers professor Eric Seymour, all three of these companies used an “extensive network of more than 190 corporate aliases registered to 74 different addresses across ten states and one territory.” They point out that by anonymizing themselves it could protect them from legal liability or tenant accountability. One could also argue that it may sway people’s decision to rent a home from them if they assume they are renting from a small scale company as opposed to a mega investor.
Note that Vanguard and BlackRock have a stake in three of the top six. Due to this fact, some people might say that “BlackRock is buying all of the single-family homes in the U.S.” Technically, they are not “buying” them, but they certainly have a stake in the single-family rental home market as well as voting rights and control with these companies.
JPMorgan Chase & Co. got in on the action in a joint venture with AMH to develop 2,500 rental homes back in 2020, while Koch Industries invested $200 million in Amherst’s single-family rentals. The Carlyle Group, Goldman Sachs, J.P. Morgan Asset Management, Mynd Management, and KKR are other big players in the single-family rental home market.
People should really consider not selling their homes to these mega investors and instead, sell to families in need of a home. If one is renting a home it’s important to carry out due diligence and trace the LLC to its origins, or better yet – make the decision to only rent from homeowners and small mom-and-pop investors. The property tax data is a good place to start and is typically available in most counties online through the tax assessor office.
Ownership Recap:
BlackRock and Vanguard have a large stake and voting position in 3 of the top 6 companies, which have a combined 206,000 single-family rental homes. Blackstone holds ownership of over 62,000. Blackstone, Fannie Mae and Freddie Mac kicked Invitation Homes up the ladder. Pretium and Cerberus each manage over $50 billion in assets. AMH is climbing fast. These numbers only reflect the stake in the six biggest companies above.
Build-To-Rent Single-Family Home Communities
This trend really kicked off in a big way with government backing in 2008 during the financial crisis. The Biden administration has been giving it more fuel under the “Affordable Housing” scheme.
Why reduce mortgage rates and manufactured inflation for home buyers when you can just build single-family homes to rent, make a slew of money, and grab more control of the market? Roll in the necessity for “affordable houses” and roll out the red carpet for immigrants, while pushing HUD vouchers for government reliance?
Some of the biggest landlords, such as American Homes 4 Rent and Invitation Homes have actually sold some of their single-family homes while they could get top dollar, and then invested that money into the build-to-rent (BTR) single-family rental (SFR) home communities.
There is a big push for building new communities that are build-to-rent single-family homes. The Biden administration wants to build two million “affordable homes” costing $258 billion dollars to create more inventory, while 1.6 million (80%) of those homes are for rental purposes only. To understand how the “affordable homes” agenda is being used to usher in new funds, regulations, and assistance to shift the housing market from owners to renters, read the affordable housing section of Corey Lynn’s report titled University Migrant Smart Hubs, Private Equity and The Leveraged Buyout of America.
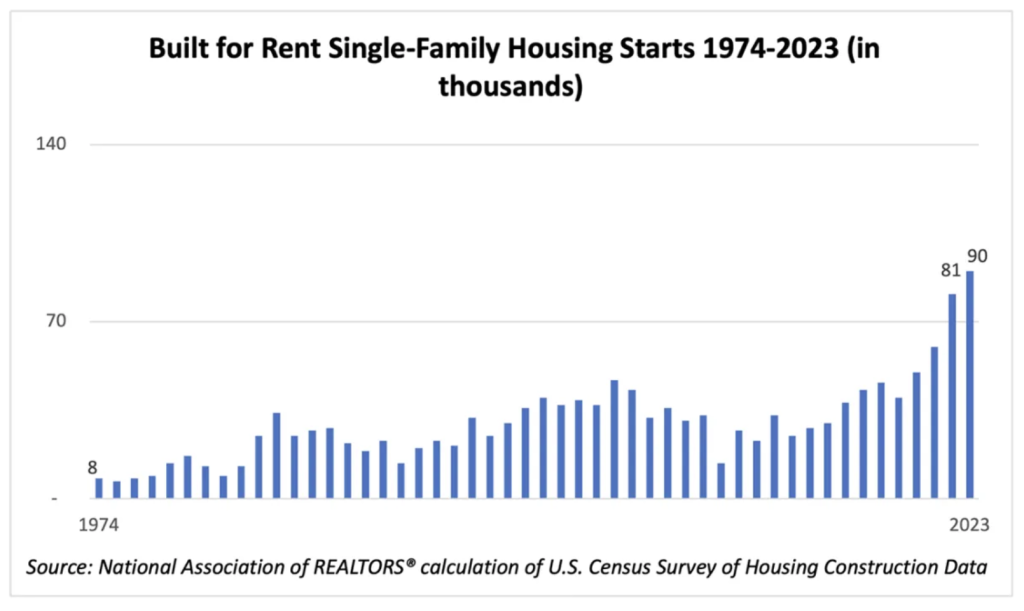
This growing trend of “build-to-rent” single-family housing went from 81,000 units in 2022 to 90,000 units in 2023. In 2021, this sector of the housing market represented 5%, which doubled to 10% in 2023. By first quarter 2024, construction had already begun on 18,000 single-family build-to-rent homes, which was a 20% increase from the first quarter of 2023. Just in the past five years, roughly 41% of the country’s build-to-rent housing stock has been constructed.
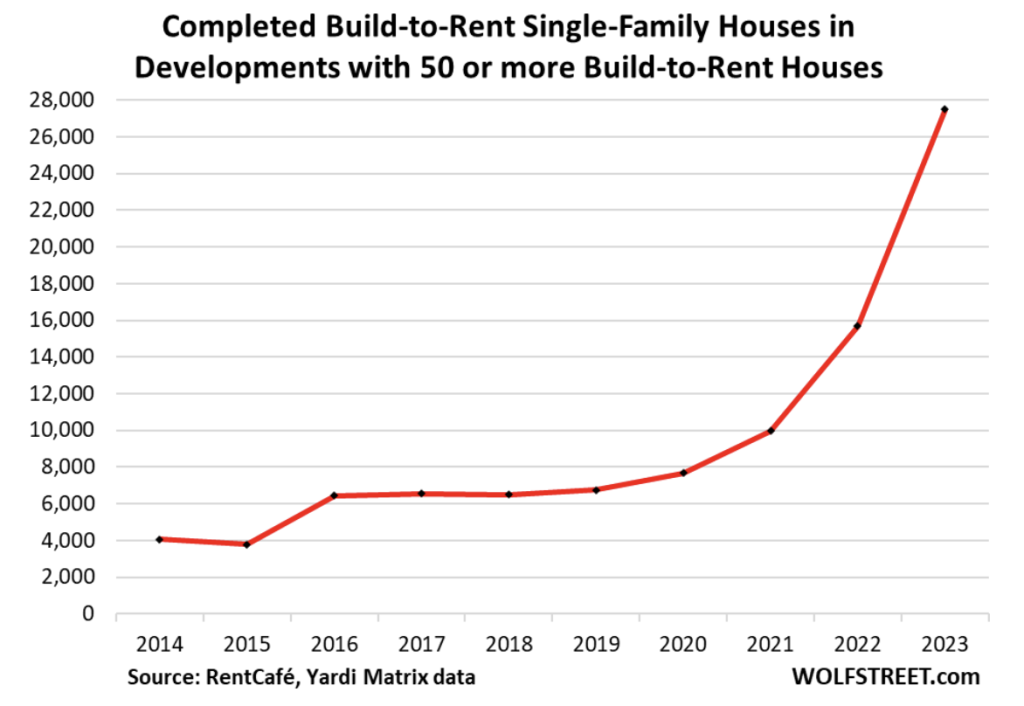
• Builders, developers and investors want in on this action. In 2023, 27,495 build-to-rent single-family homes were completed in communities with at least 50 rental homes that are professionally managed. An additional 45,400 homes in these developments were under construction.
• Take a look in nearby areas and see if one of these communities has hit near home. They are typically cookie cutter style homes packed in tightly with small to average size yards, often outfitted with “smart home tech,” bike paths, a swimming pool, gym, dog park, and located near transportation and shopping. The sales pitch is affordability, no responsibility, and amenities. The term “build-to-rent” is often used as “built-to-rent” or “build-for-rent” or “build-to-rent.” Some reports will abbreviate and refer to this market as BTRs. Keep this in mind when searching locally.
• According to a WSJ article on the construction of rental homes, in 2023, developers completed 93,000 new rental homes which is a 39% increase from the prior year. This includes townhouses, duplexes, small cottages and detached single-family homes.
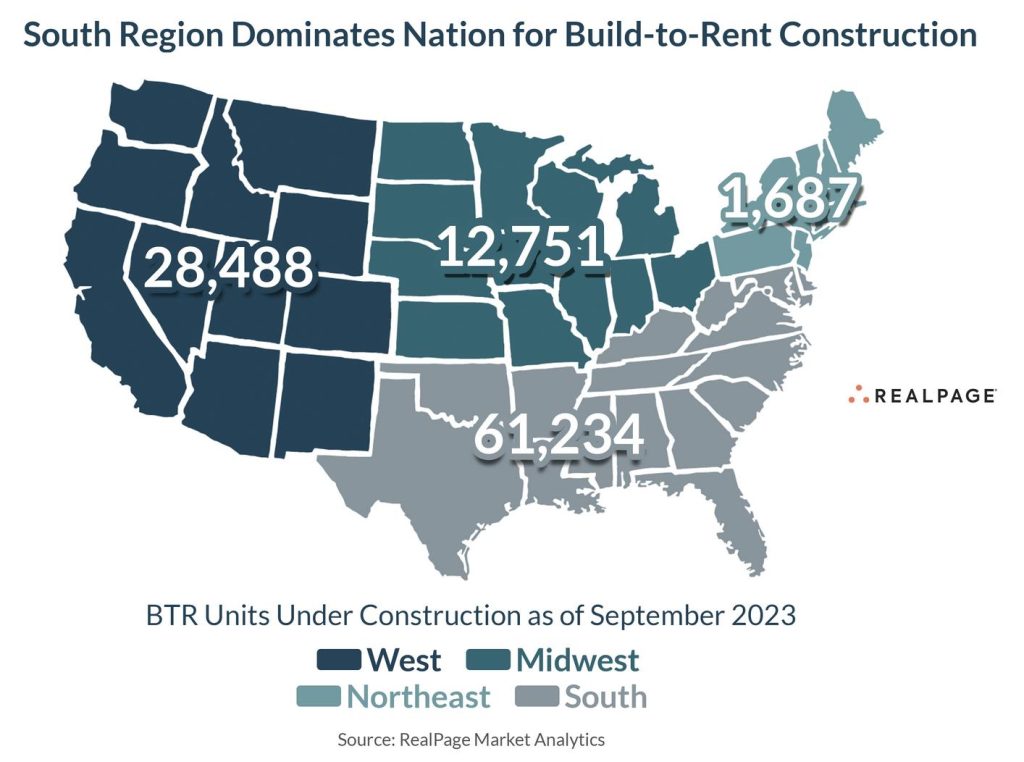
• According to a RealPage report, there were actually 104,160 build-to-rent units under construction by September 2023, with the South Region dominating. The mega investors align with these locations. See maps above. This consisted of single-family housing that is fully detached, semi-detached, row houses, duplexes, quadruplexes and townhouses that were built for rental purposes.
• As one example, AMH develops build-to-rent communities across 13 states with a heavy presence in Florida (48 communities), Georgia (25 communities) and Nevada (25 communities). Check out their site to see what these communities look like.
Based on units under construction in 2023, the top five builders were:
Cavan Cos.
Private company
Redwood Living Inc.
Private company
Taylor Morrison
Top shareholders: BlackRock, Vanguard, Dimensional Fund Advisors, State Street Corp
American Homes 4 Rent (AMH)
Top shareholders: Vanguard, BlackRock, Norges Bank, State Street Corp
NexMetro Communities
Private company
There are a multitude of companies financing these build-outs. Below are just a handful of examples:
All of the largest and best known private equity firms, such as Blackstone (see private equity section), Apollo Global Management, Kohlberg Kravis Roberts (KKR), Bain Capital, TPG Capital and Carlyle Group are all invested in build-to-rent single-family communities.
> Acres Capital provided a $28 million construction loan for Cavan Companies BTR bungalows in the Phoenix area.
> Arbor Realty Trust also finances single-family BTR communities. In 2020, Arbor provided a $32.1 million loan to AHV Communities to build a massive 250-unit community in San Antonio, TX.
> Berkadia financed a 72-unit BTR SFR community in Edmond, OK for $16.1 million.
> Corevest Finance has closed roughly $1.5 billion in loans for 10,000 BTR units.
> Freddie Mac and Berkadia closed an $11 million loan for TrueLane Homes in 2018 under a Freddie Mac pilot program specific for affordable single-family rental properties so TrueLane could expand into Atlanta, Cleveland, Columbus, Houston, and Oklahoma City.
> Pretium (parent company to Progress Residential) has financed over $2.5 billion in BTR SFRs.
> NewPoint Real Estate Capital launched a national BTR financing program for BTR single-family communities.
> Northmarq has completed more than $1.5 billion single-family rental transactions.
> Simmons Bank financed a 260-unit BTR to Middleburg Communities in Midlothian, Virginia. Middleburg has four build-to-rent developments under construction in Charlotte, North Carolina; Charleston, South Carolina; Jacksonville, Florida; and Wilmington, North Carolina, in addition to the Huntsville project and two developments in Richmond.
> Stockbridge Capital Group and MORE Residential partnered in a $4 billion venture to purchase newly built single-family rental communities. Stockbridge is also heavily invested in manufactured housing communities.
• The build-to-rent industry is taking hold in multiple countries, not just in the U.S. Australia, New Zealand and Europe are in on the game, and the UK recently surpassed 100,000 units with 54,000 under construction and another 112,000 in the planning stages.
In short, the build-to-rent market is becoming quite popular, on a rapid upward growth and will likely be one of the bigger markets to keep an eye on in the future. If you can’t buy them – build them.
Ownership Recap:
Private equity firms are all over this industry and BlackRock, Vanguard and State Street Corp. have a big stake and voting rights with two of the top five developers of these build-to-rent communities, as well as some of the private equity firms.
Foreign-Owned U.S. Residential Property Stats
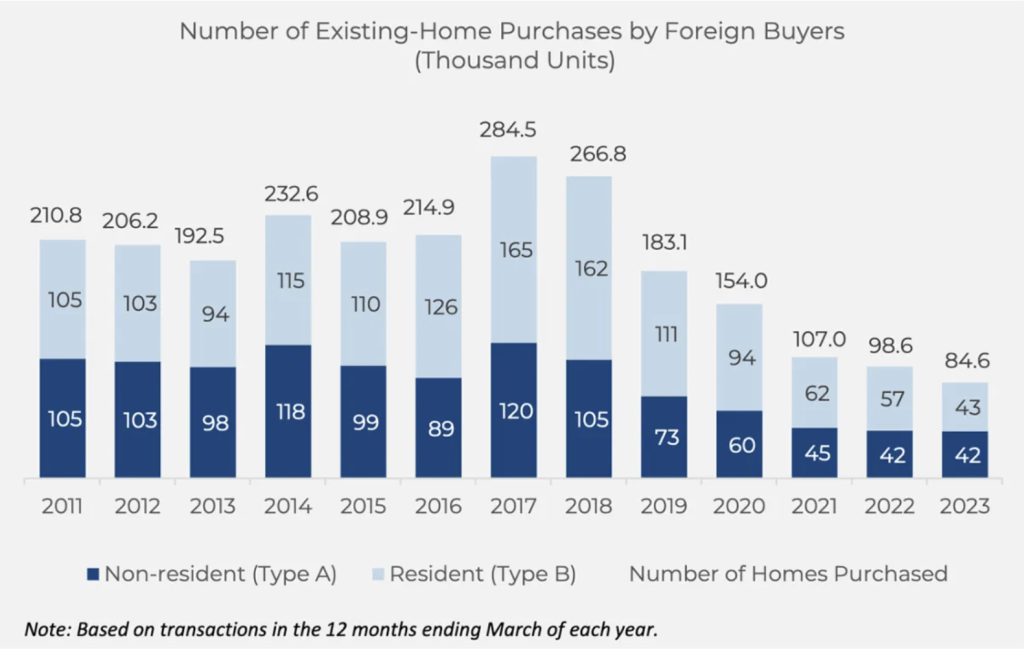
Source: National Association of Realtors
The chart above represents existing-home purchases from foreign buyers, but does not account for foreign investors and developers. Between 2014-2024, nearly 1.9 million U.S. homes (both single-family and multifamily) were purchased by foreigners.
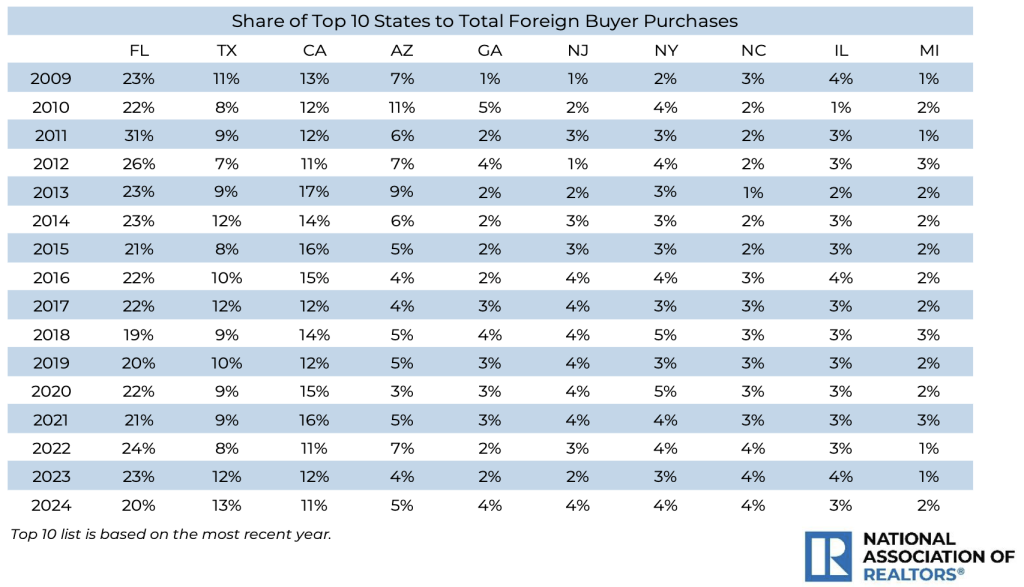
Florida has been the top destination for foreign buyers for 16 years in a row, which accounts for 20% of all international purchases. Texas moved into second position with a 13% share, followed by California at 11%, Arizona at 5% and Georgia at 4%. Florida draws buyers from Latin America and Canada, while Texas buyers came from Latin America/Caribbean, Asia, Mexico and India. Chinese and Mexican buyers are drawn to California while Canadians are all about Arizona. Georgia is a mixed bag, drawing from Latin America, Asia, Africa, and Europe.
Between April 2022 and March 2023, foreign buyers purchased 84,600 properties worth a total of $53.3 billion, which decreased to 54,300 properties worth a total of $42 billion by March 2024. Believe it or not, this is the fewest number of U.S. homes purchased by foreigners since 2009. $22.6 billion of the $42 billion represents foreign buyers who resided in the U.S. as recent immigrants or who held visas. The remaining $19.4 billion represents buyers who lived abroad. 50% of homes purchased were all-cash deals.
Overall, foreign buyers accounted for 2% of the $2.1 trillion in existing-home sales between April 2023 – March 2024.
The chart below shows the top 10 countries of origin to foreign buyer purchases. Just as with foreign-owned U.S. farmland, Canada leads the way. In the case of U.S. homes, the top five in order of purchases for 2024 are Canada, China, Mexico, India and Colombia.
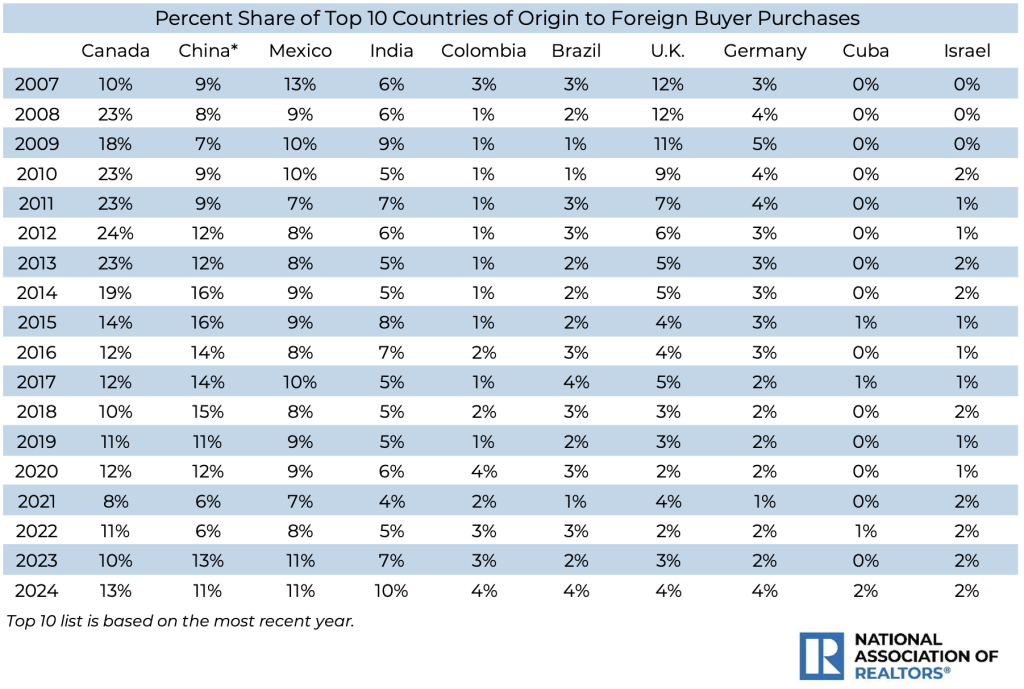
45% of foreign buyers utilize their U.S. home as a vacation home and/or rental property, and 79% purchased a detached single-family home or townhome, 16% purchased a condominium, 5% purchased residential land, and 4% fell under “other.” 45% of all purchases were in a suburban area.
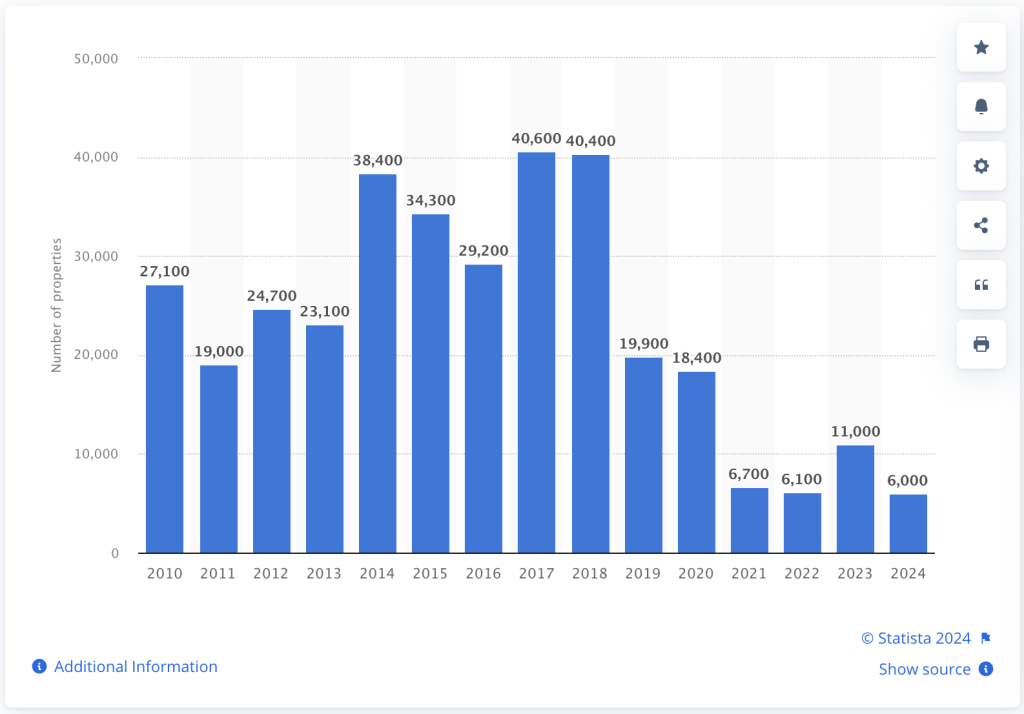
For perspective, below are three graphs showing the amount of U.S. residential homes (single-family and multifamily) purchased by foreign buyers from Canada, China, and Mexico between 2010 and 2024. In comparison, Canadian buyers purchased 446,100 homes, Chinese buyers purchased 344,900, and Mexican buyers purchased 242,200.
Canadian foreign buyers purchased 446,100 U.S homes between 2010 – 2024.
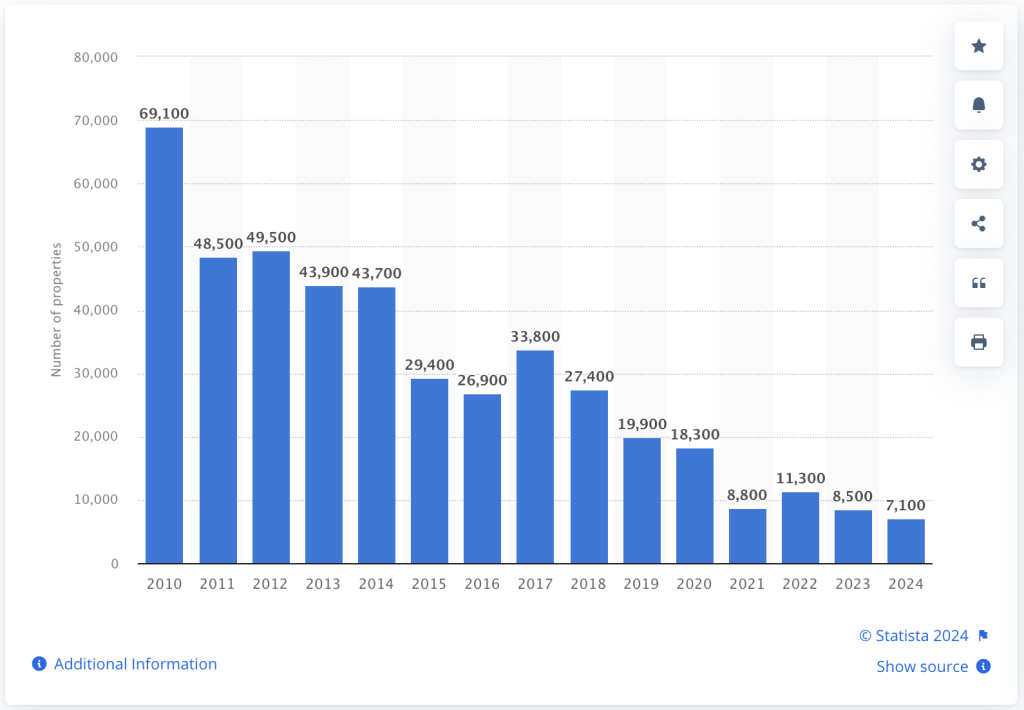
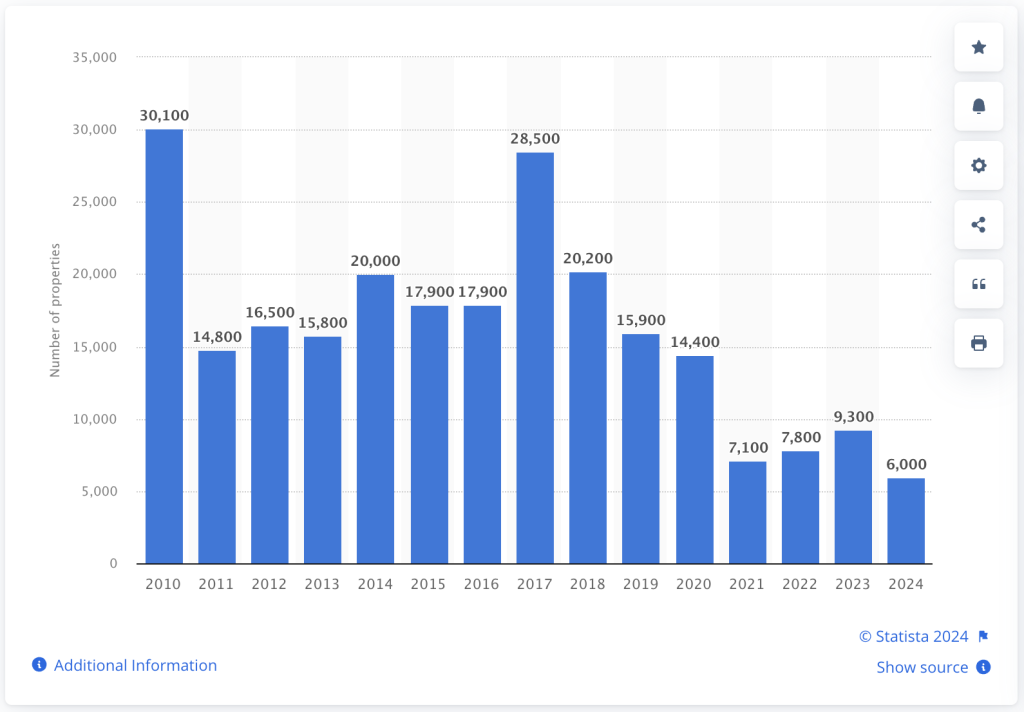
Chinese foreign buyers purchased 344,900 homes between 2010-2024
Mexican foreign buyers purchased 242,200 homes between 2010-2024
Between those three countries alone, that’s over one million homes in the past 14 years. Foreign buyers accounted for 1.3% of 4.06 million existing home sales between April 2023 – March 2024.
Manufactured Housing Communities
This sector of the housing industry has taken a beating from private equity firms and hedge funds, which is why it was important to include it in this report. After all, over 21 million Americans live in 7 million manufactured and mobile homes, while 1 million remain vacant according to recent statistics by the U.S. Census Bureau. The Bureau classifies manufactured and mobile homes as one in the same under “mobile homes” but manufactured homes are factory-built housing that looks like a small single-family home. Whereas some homes in these communities are in fact “mobile,” 80% are stationary.
71% (5 million) manufactured homes are owner occupied and 29% (2 million) are renter occupied. Whether they are owned or rented, manufactured home communities charge lots fees and often other fees for use of amenities and/or utilities.
There are presently over 43,000 manufactured housing communities with approximately 75% owned by mom-and-pops and 25% owned by private equity firms, hedge funds, and big corporate chains.
In 2020 and 2021, Institutional investors purchased 23% of all manufactured home sales. Residents at manufactured home communities have reported that they’ve endured as much as 60% rent increases when private equity-owned landlords took over.
As author Bredan Ballou described in his book Plunder: Private Equity’s Plan to Pillage America, “They targeted, not those with the most money in America, but those with the least. Nowhere was this clearer than in the case of mobile home parks. And all of this was accomplished with the active support of the government, whose sponsored entity, Fannie Mae, helped to start the fevered rush to acquire homes.”
Almost half (49%) of private equity-owned parks were financed by Fannie Mae or Freddie Mac as compared to only 9% of all the manufactured home parks in the entire U.S.
According to extensive research by the Private Equity Stakeholder Project, one in seven manufactured home parks in Michigan is owned by a private equity firm, accounting for 121 parks with 34,258 lots. Florida and Texas are in the top three states, alongside Michigan, with private equity firms owning 2% (124) of Texas parks and 5% (197) of Florida parks. More than 80% of Blackstone’s lots are in Arizona and Florida and almost all of Carlyle Group’s are in Arizona and Florida as well.
Twelve private equity firms own 1,232 manufactured housing parks in the U.S. with over 250,000 lots, as documented in this chart the Private Equity Stakeholder Project published. Those are just the ones that they tracked. All communities by name, addresses, and ownership of the 1,232 parks they tracked can be viewed here.
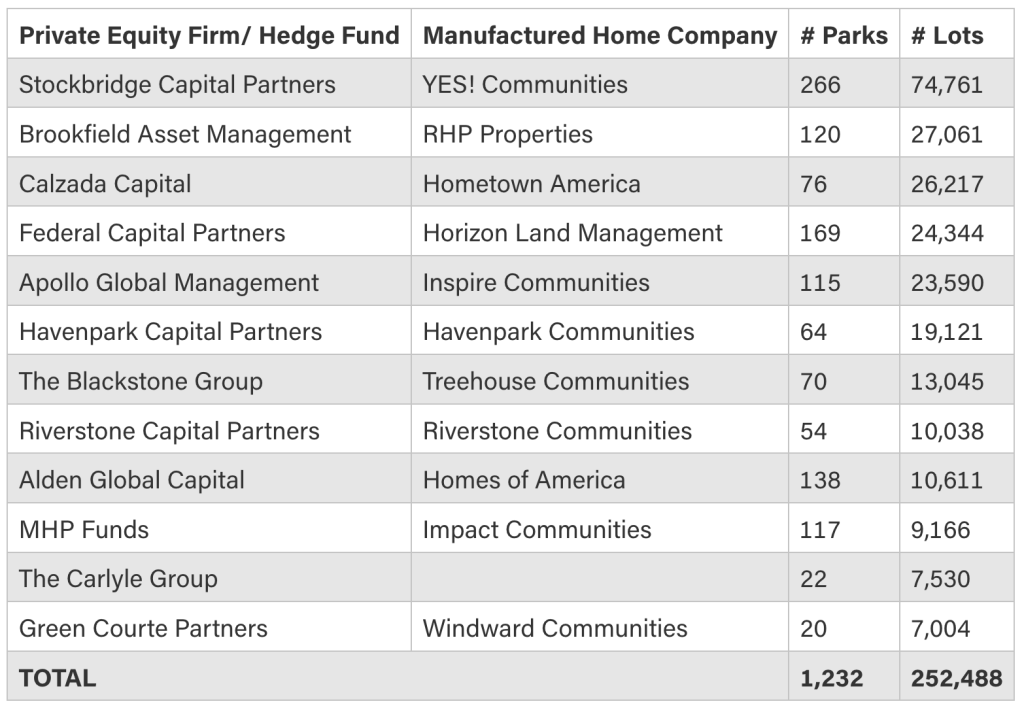
Appollo Global Management (Inspire Communities), Blackstone (Treehouse Communities), and The Carlyle Group all own manufactured housing portfolios and happen to be three of the four largest private equity firms in the U.S. Many of the private equity firms in the chart above are also involved with the build-to-rent single-family communities, as documented in the build-to-rent section above.
Private equity firms know that their return on investment is huge. They swoop in to these low-income communities, jack up the rent and fees, forcing people to work extra hours to cover the increase because moving a manufactured home is very costly, then they turn around within a few years and sell it for a big profit. There are horror stories about how they treat these communities and the lack of care. Meanwhile, Fannie Mae and Freddie Mac are backing these private equity firms that are exploiting the residents, and have done little over the years to protect tenants, nor have they set a limit for rent increases.
So while the private equity firms and other big institutional investors cry out that they are all in the real estate market to bring “affordable housing” to help the people of this great country, don’t be fooled. They are in it for one thing and one thing only – money.
For those currently living in a manufactured home community or looking to buy a home in one, the information on this site is invaluable and also provides an entire section on protecting residents and calls to action.
Ownership Recap:
Whereas the mom-and-pops still hold the majority ownership in manufactured home communities at 75%, private equity firms, hedge funds and corporate giants have been playing the game of driving up rents to later flip them for a lot of cash.
Vacation Rental Homes Market
The vacation rental industry has been on an upward trend, with millions of single-family homes and apartments for rent on a short-term basis. Vacation rental homes are outpacing hotels by a 24% growth rate between January and May 2023, while hotels remained at 0% growth. Many homes are second homes that people utilize as vacation rentals for themselves when not renting them out. There are over 1,700 vacation rental companies pulling in more than $1 million in revenue.
The Top Four Vacation Rental Companies with Revenue in The Billions:
1) Bookings Holdings
2023 Revenue: $21.36 B
Top shareholders: Vanguard Group, BlackRock, Capital World Investors and State Street Corp
2) Expedia Group
2023 Revenue: $12.83 B
2023 VRBO Division Revenue: $3.3 B
Top shareholders: Vanguard Fiduciary Trust, BlackRock, State Street Corp, JPMorgan
3) Airbnb
2023 Revenue: $9.92 B
Top shareholders: Vanguard Group, Fidelity, BlackRock, Capital Research & Management
4) Tripadvisor
2023 Revenue: $1.8 B
Top shareholders: BlackRock, Vanguard Group, Ameriprise Financial, Fidelity International
It’s no shock that once companies hit the billions, Vanguard and BlackRock will be two of the top shareholders.
It’s interesting to point out that in December 2020, Airbnb launched Airbnb.org for hosts to provide free and discounted housing to refugees. Since its inception, Airbnb states that more than 210,000 refugees and asylum seekers have received free, temporary housing.
Some of the largest short-term rental property managers are Vacasa, Evolve, Sonder, Casago, Hosteeva, Vtrips, and iTrip, as of 2022. However, this is a fluctuating industry with new growth every year. Vanguard is invested in Vacasa and Sonder, and Vacasa has partnered with Marriott.
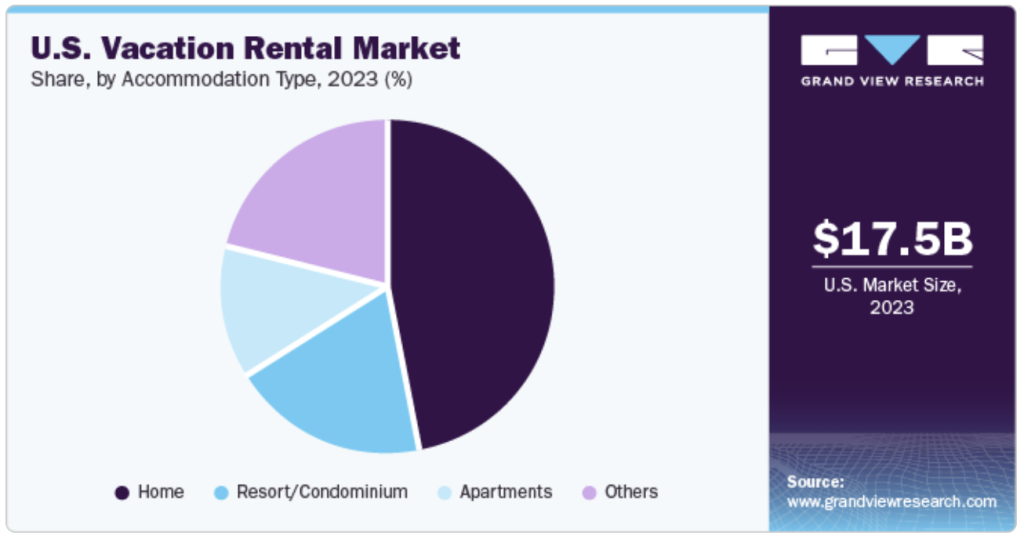
In the U.S. alone – the largest vacation rental market – 60 million people stayed in a vacation rental in 2022. It’s a big industry with 7 million active listings on Airbnb alone. The North American market revenue share accounted for 24% and is expected to hold through 2030. The U.S. vacation rental market was estimated at $17.5 billion in 2023 and is forecasted to grow to over $21 billion by 2030. The global vacation rental market size was at $89.3 billion in 2023 and is forecasted to grow to $119 billion by 2030.
Single-family homes make up nearly half the vacation rental market in the U.S.
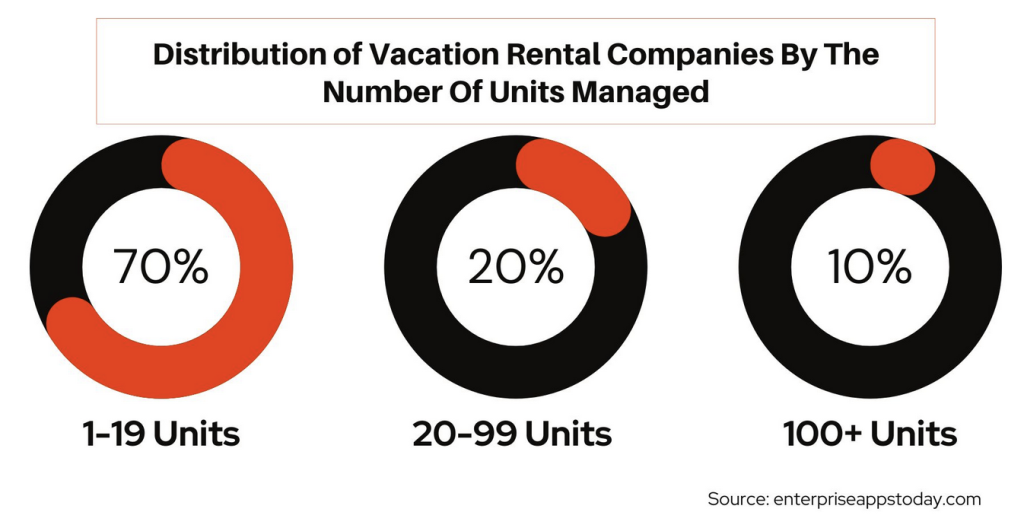
The distribution of vacation rental companies by the number of units managed shows that 70% account for 1-19 units, while only 10% account for 100+ units. The mega investors are likely more apt to invest in online platforms and large management companies, while not getting their hands dirty with all of the day-to-day logistics required to manage and turnover vacation rentals.
Even Marriott got in on the action and launched “Homes & Villas by Marriot Bonvoy” in 2019, offering vacation rental homes. Of course, BlackRock, Vanguard, and State Street are top shareholders of Marriott.
Ownership Recap:
Once again, BlackRock and Vanguard dominate this sector by being top shareholders to all four top vacation rental companies. The difference here is that these companies do not own housing stock, they get a slice of the pie from renting (or providing a platform to rent) the homes on behalf of the owners.
Student Housing Market
The student housing market is a huge market worth mentioning here because private equity firms, such as Blackstone, are heavily involved, and it gets much worse than that. Read Corey Lynn’s report titled University Migrant Smart Hubs, Private Equity and The Leveraged Buyout of America, for an in depth look at what is happening at colleges and universities as it pertains to student housing and illegal immigrants. This report also documents the land grabs as well as buildings being converted to student housing across the country.
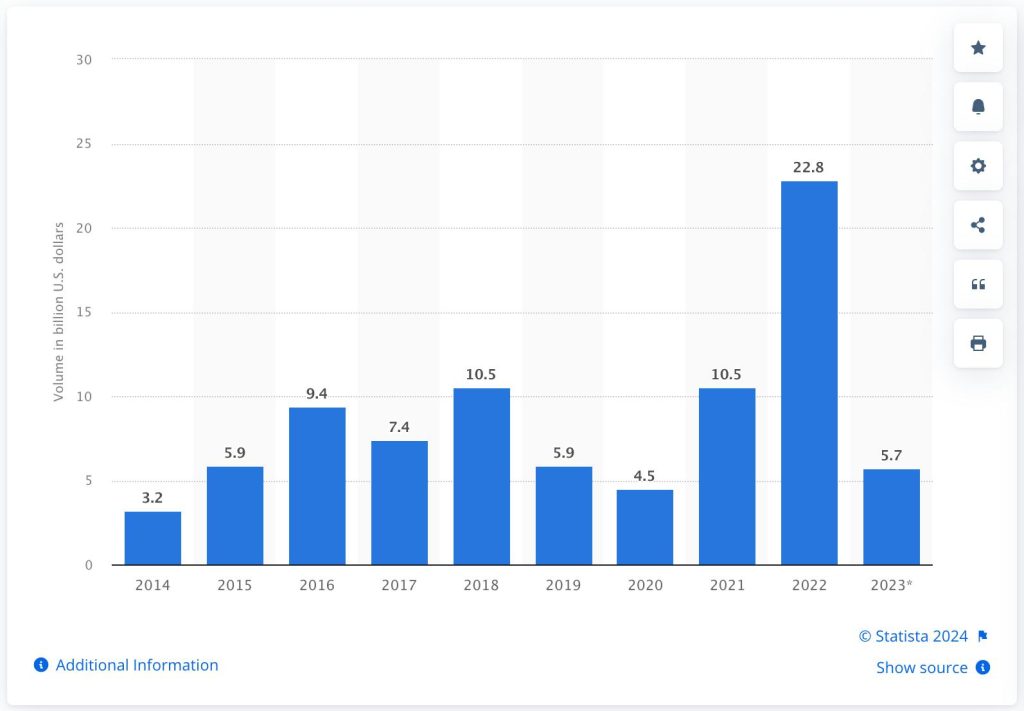
This chart indicates the value (in billions) of investment transactions in student housing in the U.S. from 2014 to 2023. 2022 was exceptionally high due to Blackstone’s acquisition of American Campus Communities.
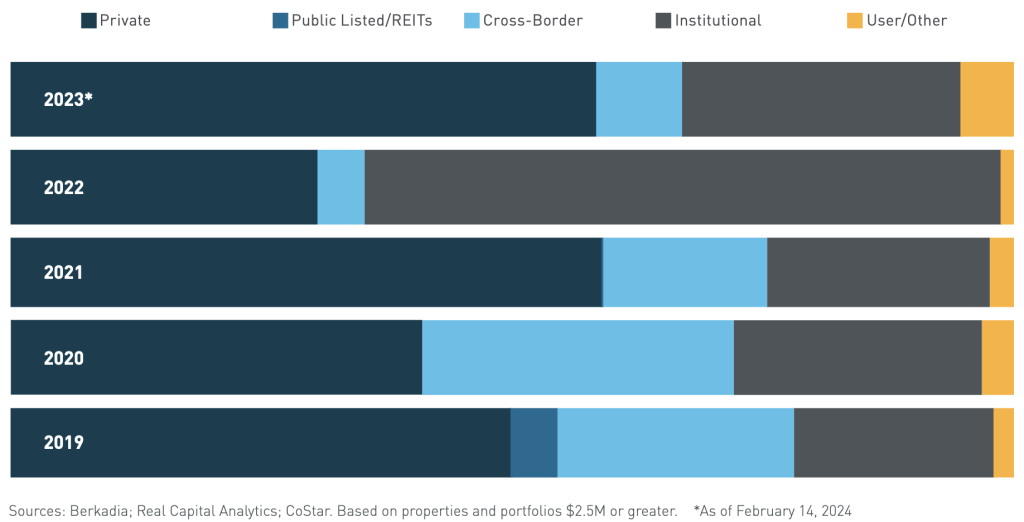
Below shows the distribution of investment activity based on properties and portfolios of $2.5 million or greater as of February 2024.
Over eight million students require student housing near campus in the U.S. and studies have shown they want single occupancy with all the mixed use amenities and smart features, which is a perfect fit for micro smart cities. Roughly 22% of university students live in on-campus dorms and residence halls, 23% live in off-campus student housing, and 55% choose nearby rentals.
In addition to Blackstone recently acquiring the largest student housing company in the U.S., the industry itself appears to be booming. The top five largest student housing real estate companies in the U.S. are American Campus Communities (recently acquired by Blackstone), The Scion Group, Greystar Student Living, Cardinal Group, and Asset Living. Other big ones in the running include Landmark Properties and Harrison Street Capital. Blackstone’s top shareholders are Vanguard, BlackRock, Capital World Investors, and State Street Corp. Blackstone is covered at length in the report linked above.
In a 2021 National Multifamily Housing Council white paper on The Future of U.S. Student Housing Demand, they stated that “the ability to relocate and quarantine students will become increasingly important as the role of buildings in public health policy gains renewed emphasis and is supported by new technologies.” They also stressed the need for public-private programs to improve building quality and projected that student housing will grow from 8.5 million beds in 2020 to 9.2 million by 2031.
According to a 2023 Berkadia report, effective rent growth across the top universities rose 7.9% between August 2022 and August 2023, which is more than three times the rate of market-rate rent growth across the country.
2024 is expected to be a solid year for the student housing sector, with an average occupancy rate of 95% across the top universities, and an expected enrollment of 19.25 million students.
Foreign investors also play a role in U.S student housing – investors such as London-based Global Student Accommodations, GFH Financial Group out of Bahrain in the Middle East, Abu Dhabi Investment Fund, Saudi Arabia-based company Riyad Capital, and Singapore-based CapitaLand Investment Limited whose parent company is Temasek.
Ownership Recap:
Blackstone is leading the way in the student housing market with BlackRock and Vanguard as top shareholders. Foreign investors play a sizable roll in the student housing market as well. Greystar just became the largest apartment owner and/or manager with over one million units in the U.S.
The Affordable Housing Scheme
The “Affordable Housing” push over “lack of homes,” increased mortgage rates and property taxes, skyrocketing homeowners insurance in some areas, and overall inflation, was all manufactured for home, land, and commercial real estate grabs by big financial firms to bring in a new wave of build-to-rent home communities and mixed use apartment complexes, more affordable off-campus student housing, and housing for illegal immigrants. Ultimately, this was done for the purpose of moving people into a control grid enslavement system where you own nothing and are “happy,” while they own everything.
One of the biggest pushes for affordable housing is lack of homes. Are there? According to the U.S. Census Bureau, the U.S. population is allegedly at 337.1 million people, made up of 131.3 million households with the average number of people per household at 2.5, which accounts for 328.2 million people, leaving 8.9 million people unaccounted for. Yet, there are 146.6 million housing units in the U.S. which would technically house 366.5 million people. Housing units include all housing whether single-family or multifamily so long as they have their own entrance. This includes manufactured & mobile homes which nearly 21 million Americans live in. Dormitories, barracks, transient hotels, and hospitals are not included as housing units. 1.9 million students reside in dormitories and hundreds of thousands of service members live in military barracks. That accounts for 2.5 million people. In 2023 there were roughly 653,000 homeless people. This leaves us with roughly 5.7 million people unaccounted for and 15.3 million housing units still available to accommodate over 38 million people (based on 2.5 avg per household). Of course, there are over 6.5 million second homes owned by people in the U.S. that might not be rented out, so that figure could be reduced to 8.8 million available housing units. If they are not homeless and do not have a housing unit, who exactly makes up the 5.7 million mystery people? Technically, transient hotel goers would fall under homeless because there would be no way to track that. Could it be the millions of immigrants that have come through the borders over the past five years?
According to the U.S. Census Bureau’s July 2024 report on residential vacancies, they calculated that 6.6% of rental housing and 0.9% of homeowner housing sat vacant in the second quarter of 2024, which totaled 15.2 million vacant homes (of that 3.5 million were seasonal vacant), which is almost right on the money with the figure of 15.3 million calculated above. So are there a lack of homes? No. Are there a lack of affordable homes? Pretty much everywhere, due to manufactured inflation, rental rate increases and mortgage rates. That goes for darn near everyone. Are there a lack of homes in geographic locations where the population is more dense? Perhaps.
The Biden administration wants to build two million “affordable homes” costing $258 billion dollars, to create more inventory, while 1.6 million (80%) of those homes are for rental purposes only. A new bill was recently introduced by Reps. Adam Schiff and Jimmy Gomez, D-Calif., to convert unused government buildings into affordable housing, which includes a grant program “to help state and local governments convert properties into qualified residential rental projects.”
There are a lot of “affordable housing” plans in the works with the Federal Housing Finance Agency, the Bureau of Land Management, the United States Forest Service, United States Postal Service, HUD, and the Department of Transportation to repurpose public land, buildings, and forests to create affordable housing. They’ve had an incredible jumpstart with all of this, ever since the manufactured destruction of buildings across America with riots after the George Floyd scandal, during the tyrannical Covid lockdowns so they could buy up all the shuttered real estate.
Bank of America Community Development Banking (CDB) provided $7.1 billion in debt and equity financing in 2023 to build and preserve 11,000 affordable housing units. They are committed to the UN Sustainable Development Goals (the Great Con). CDB focuses on mixed use developments that incorporate “health and well-being” programs and onsite-care.
The “Affordable Housing” scheme is covered more in depth in Corey Lynn’s report titled University Migrant Smart Hubs, Private Equity and The Leveraged Buyout of America.
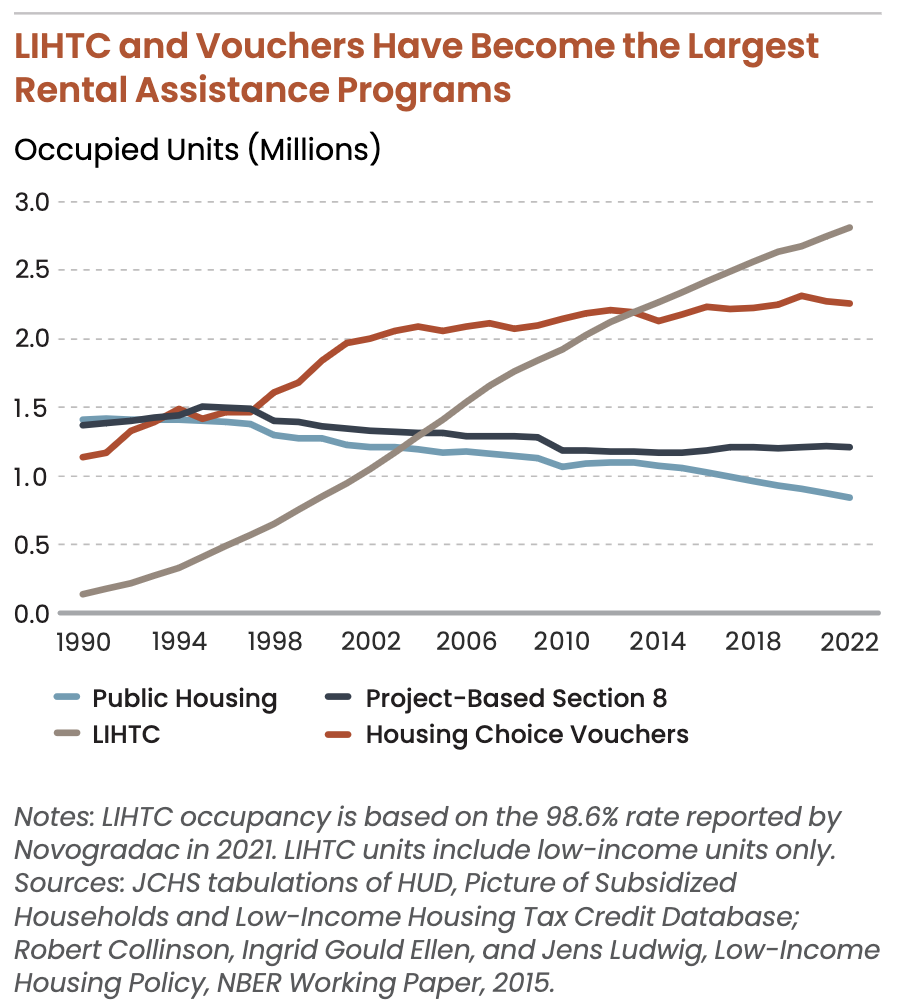
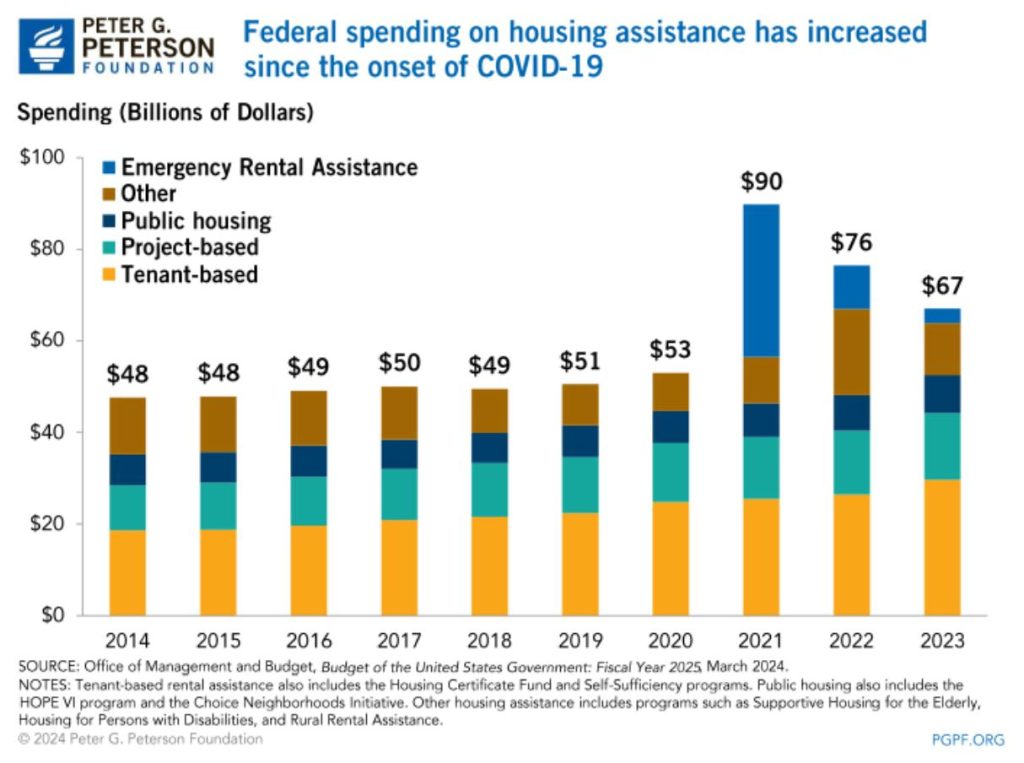
Housing vouchers and rental assistance is on the rise, which is covered more in depth in the above linked report. The low-income housing tax credit (LIHTC) federal program that awards tax credits to housing developers for reserving a portion of rent-restricted units for lower-income households, and housing choice vouchers, are the largest rental assistance programs. The vouchers alone assisted 2.3 million renters in 2022.
Invitation Homes, one of the largest single-family rental home companies, with top shareholders being BlackRock and Vanguard, helped more than 15,000 residents obtain $116 million in federal rental assistance in 2022 alone. They also partnered with over 150 public housing authorities to serve thousands of their residents who received housing assistance as well as HUD’s Housing Choice Vouchers. Firstkey, Blackstone’s Tricon Residential, Progress Residential, and all of the other big companies accept vouchers as well. Even the small mom-and-pops are doing it. Why not? It’s guaranteed pay. But there is a bigger picture people need to keep in mind when it comes to government “assistance.”
Private Equity and Large Investors
Private equity firms and mega institutional investors are heavily involved in real estate and carving out new industries to capitalize on. The single-family rental homes and build-to-rent communities are definitely on par to see major growth in years to come. If you can’t buy up the homes – then build them – wait out the baby boomers and pick up those homes down the road while moving the younger generations into the single-family rental home communities stocked with smart home tech and amenities.
Catherine Austin Fitts of The Solari Report provides an excellent description of exactly what private equity is. She explains, “It is equity investment that is managed privately by investment companies that buy, reengineer, and sell companies, principally with funds raised from both institutional and retail investors. Instead of a company financing in the stock market with public equity, it is owned in large part or in whole by an investment company. Often, this occurs when a private equity company buys a public company and then takes it private—not infrequently with the use of debt to finance the purchase (in what is known as a “leveraged buyout”). Increasingly, the large private equity firms finance in the public equity markets and trade on the stock exchange. One of the reasons that the number of companies traded on the U.S. stock market has diminished is as a result of the growth of private equity firms.”
In Brendan Ballou’s book Plunder: Private Equity’s Plan to Pillage America, Ballou shows how private equity firms KKR, Carlyle and Blackstone own more companies than every business listed on the U.S. stock exchanges combined. He also points out that roughly one in five large companies acquired through leveraged buyouts go bankrupt in a decade.
Ballou’s book covers how private equity firms are destroying America and goes into specifics about their involvement in the housing industry, health care, nursing homes, retail, and prisons while providing insight into case studies, finances, the courts, local governments and Congress, pension funds and retirement savings, and special tax treatments these private equity firms benefit from. Ballou dedicated an entire section on what we must do and an agenda for reform. It is a highly recommended book. Ballou is a federal prosecutor who has served in the National Security Division and as Special Counsel for Private Equity in the Antitrust Division at the U. S. Department of Justice.
In 2017, despite 136 nonprofits opposing it, Fannie Mae injected $1 billion into a 10-year loan originated by Wells Fargo, in a first time government-sponsored enterprise to a large institutional operator of single-family rental properties – Invitation Homes, owned by Blackstone at that time. This catapulted Invitation Homes into what it is today. After running two-year long single-family rental pilot programs, Fannie and Freddie exited the single-family rental market.

But that’s not when private equity firms made their single-family home debut with Fannie and Freddie. Not long after the 2007 housing market collapsed when millions of Americans lost their homes, instead of reselling the homes to families, the Federal Housing Finance Agency (regulator of Fannie and Freddie) and Federal Reserve thought creditors could make more money on renting than selling properties. Private equity firms didn’t previously contain single-family homes in their portfolios, but come 2012 when the FHFA began auctioning off bundles of homes to be converted to rentals so individuals couldn’t get in on a single home, big investors utilized special software that cued them in to which properties would make the most money, and bought up hundreds of houses at a time. Colony Capital purchased 970 properties in California and Fannie jumped into a partnership with Colony to operate, lease, and manage over a thousand homes.
In just two years, private equity firms and hedge funds purchased roughly 350,000 bank-owned homes. Fannie sold out American homeowners to big investors. Lack of rental control, increased rents, added fees to tenants, lack of maintenance, forced evictions, and eventual lawsuits ensued against some of these private equity firms. Even til this day the lawsuits continue, while these firms buy up and build out more rental homes. On August 23, 2024, the Department of Justice and eight states filed a lawsuit against RealPage, a real estate software company owned by private equity firm Thoma Bravo, for enabling collusion among landlords to engage in price fixing and raise rents for millions of Americans. Numerous large private equity firms, including Blackstone, the largest landlord in the country, uses RealPage’s software, YieldStar, to set rents for nearly 350,000 rental housing units in the U.S. alone.
Over the past few years, Blackstone has invested $9.5 billion into the single-family rental market, including the acquisition of Tricon Residential for $3.5 billion. Blackstone has bought up apartment blocks, student housing, single-family housing rental companies, senior care homes, offices, hotels, logistics warehouses, data centers, mobile home parks, and film studios, with over 350,000 units of rental housing in the U.S. Blackstone claims to own less than 1% of rental housing in the U.S. Blackstone’s real estate business has $337 billion of investor capital under management. However, in April 2024, Blackstone announced acquiring AIR Communities valued at $10 billion, which finalized on June 28, 2024. AIR Communities portfolio boasts 77 communities across 10 states totaling 27,385 apartment units.
BlackRock ($10.6 trillion), Vanguard ($9.3 trillion) and State Street Corp ($4.4 trillion) have a combined $24.3 trillion in assets under management. They control 74% of the equity ETF market and have a huge amount of voting rights and control over how companies are run. Sure, they are investing for their clients who own the stocks, but make no mistake, the money they are making and the control they wield is astronomical.
From residential to commercial, industrial, building supplies, manufacturers, distributors, cell towers, cable and wifi, storage, software, and marketing – BlackRock, Vanguard, and typically State Street hold the real estate sector in the palm of their hands when it comes to voting rights and control. Just to name a small handful: American Tower Corp. (cell towers), BlueLinx, Builders FirstSource, CubeSmart, Ferguson, Home Depot, Invesco, Lowe’s, Redfin, Zillow, plus numerous others already mentioned throughout this report. Here is a list of 100 top real estate stocks.
Technically, BlackRock is not “buying up” single family homes, but they certainly have top voting rights and control over some of the top companies in the industry. BlackRock got so hammered on this topic that they put together a response on their website. Their response states that they are a significant investor in mortgage securities, they are invested in several programs that provide financing to build new homes, they invest in multifamily properties, apartment complexes, and other residential real estate, and most recently began investing in construction of for-rent housing developments with a focus on single-family rental housing. According to BlackRock, they have invested $120 billion into the U.S. residential real estate market on behalf of their clients but do not buy individual single-family homes. Their key geographic locations for real estate investments are North America, Europe, Asia-Pacific and Latin America.
Corey’s Digs has reported on BlackRock and CEO Larry Fink in numerous reports. For those who aren’t familiar with BlackRock – you should be. They are involved at the highest levels of this attempted financial takeover, the going direct reset, climate hoax, ESG, and digital control grid. BlackRock is the largest asset manager in the world with over $10 trillion in assets under management. BlackRock and Vanguard are top shareholders of one another, so it’s quite the powerhouse.
The Biggest Takeaways
The great news is that individual homeowners are holding the majority of the housing stock in nearly every sector except for multifamily units. Mom-and-pops are in strong force in the single-family rental homes, vacation rentals, and manufactured housing communities and mobile home parks, beating out the mid-size and large investors.
Though there has been a misconception as to how many houses are actually being bought by the big investors, it is quite clear that the big institutional investors are making bold moves and engineering the industry to work in its favor. From policies to regulations, zoning, affordable housing programs, tax credits, lobbying, fraudulent land grabs, and big money – they are on a trajectory to one day monopolize the entire real estate market unless swift action is taken on the local, state, and federal level. That said, individuals and the smaller mom-and-pops are still very much in this game and can continue to build on their own real estate investments.
One key factor in play is the financial control system that “they” are attempting to rollout, which could potentially assert control over people’s bank accounts in the future, how they spend their money and when they get access to their money. That’s a play that would essentially impact every person across every industry.
This report provides a roadmap for people to make better choices as to whether they want to sell their home, buy a home, rent a place, live off grid, invest in real estate, and what locations would be the smart move. Jurisdictions are very important to take a close look at. Check out local and state plans, zoning and development, the “sustainable 2030 agenda,” mixed use structures going up, and so on.
Top Stats:
• Homeownership is at 65.6% and nearly 40% of Americans own their homes outright with no mortgage!
• There are 45.1 million rental units in the U.S. and 11.4 million account for single-family rental homes (31%), with roughly 65% of 1.5 million new annual housing starts making up single-family homes.
• On average, investors are purchasing 25% of existing single-family (attached and detached) home sales. The mom-and-pops (including the 6.5 million second-home buyers) account for 18%, investors with portfolios of 10-99 units account for 5%, and big institutional investors who own 100+ homes are buying less than 2% which accounts for roughly 800,000 single-family homes. In total, all investors account for roughly 14.4% of all single-family attached and detached homes.
• Single-family housing makes up 75% of land zoned for housing, but they are aiming to change that to expand on multifamily and smaller housing with mixed use.
• Some of the biggest hot zones for big investors of single-family rentals are: Atlanta, GA, Jacksonville, FL, Charlotte, NC, Phoenix, AZ, and other pockets along the sunbelt states.
• In 2018, 36.2% of Americans rented vs owned. As of April 2024, that dropped slightly to 34.4%.
• The build-to-rent communities are doubling by the year. Just in the past 5 years, 41% of the country’s build-to-rent housing stock has been constructed. In 2023 alone, over 27,000 homes were completed in build-to-rent communities with at least 50 rental homes that are professionally managed, and an additional 45,400 homes were under construction. Private equity firms are heavily involved and Fannie Mae and Freddie Mac helped them out.
• Between 2014-2024, nearly 1.9 million homes (single-family and multifamily) were purchased by foreigners. The biggest buyers were Canada, China, Mexico, India, and Colombia, and the biggest destination was Florida, accounting for 20% of all international purchases. 45% utilize their home as a vacation home and/or rental property and 79% purchased a detached single-family home or townhome.
• Over 21 million Americans live in 7 million manufactured or mobile homes. 71% of those are owner-occupied and 29% are renter occupied. There are over 43,000 manufactured housing communities with approximately 75% owned by mom-and-pops and 25% owned by private equity firms, hedge funds, and big corporations.
• Almost half (49%) of private equity-owned parks were financed by Fannie Mae or Freddie Mac as compared to only 9% of all the manufactured home parks in the entire U.S. Michigan, Florida and Texas are their top states of choice, although more than 80% of Blackstone’s lots are in Arizona and Florida and most of Carlyle Group’s are located in those two states as well.
• The U.S. market size of the vacation rental market was at $17.5 billion in 2023. Single-family homes make up nearly half of the vacation rental market. 70% of vacation rental homes are owned by individuals and small investors with 1-19 homes, while mega investors (100+ homes) account for only 10%. The largest companies providing a rental gateway to these homes, are all backed by mega investors as top shareholders.
• Blackstone dominates the student housing market. Over 8 million students require housing near campus. Roughly 22% live in on-campus dorms and residence halls while 23% live in off-campus student housing and the remaining 55% choose nearby rentals.
• In 2021, the National Multifamily Housing Council stated in a white paper that “the ability to relocate and quarantine students will become increasingly important as the role of buildings in public health policy gains renewed emphasis and is supported by new technologies.”
• According to the U.S. population statistics, there are 5.7 million mystery people who are unaccounted for as homeowners, renters, living in dorms or barracks, or homeless – meaning, either 5.7 million immigrants are unaccounted for (and likely far more than that), or the homeless numbers are way off.
• The “Affordable Housing” scheme cannot be overlooked, as it is one of the biggest scandals of all time to move people from homeownership into rentals while loosening regulations for developers and guaranteeing them profits.
• Foreign-owned U.S. farmland is covered in a separate report here, but it felt important to include a few statistics in this report. There are roughly 878 million acres of farmland in the U.S., or 39% of all U.S. land. That is a decrease of 66 million acres since 2000. Foreigners own 43.4 million acres with Canada owning 32% of those, the Netherlands 12%, Italy 6%, UK 6%, Germany 5% and China owning less than 1%.
Suggestions:
• Do you buy, hold, sell, or invest? The maps in this report show where the smaller and bigger investors are buying and building to rent, with a special interest in the sunbelt. It also shows where foreign investors are buying. Do you want to be in the middle of that or outside of that? Study this report and utilize the information wisely.
• When renting a home, be sure to do your due diligence on who the owners and/or landlords are. For starters, run the parcel through the local tax assessor’s office online. It’s always best to rent from and support homeowners as opposed to institutional investors. Reviews, fraud, rent increases, and eviction stats prove this point.
• There is clearly a booming market for both short-term rentals and build-to-rent homes and communities. Individuals and small mom-and-pop investors may want to consider jumping into these markets and staving off the mega investors from grabbing up additional properties. It could even be a very small-scale community with a dozen small homes, located in a fantastic area. Communal gardens would be a great addition as well!
• Those two markets above also create niche markets that coincide with them that other individuals might consider capitalizing on, such as marketing, cleaning services, management of turnover, stylizing the interiors, and so on.
• Teach children about construction at a young age and as they get older teach them about plumbing and electricity, and how to build homes. High school’s should incorporate building tiny homes. Once they are old enough, they can purchase their own land and build their own home.
• Keep an eye on local markets to see what is being purchased and built. Be sure to look into the many affordable housing schemes taking place as well. It’s important to know your neighbors, who owns the neighborhoods, and what zoning and development changes are being made.
• Talk with your local and state representatives about your concerns over private equity firms buying up properties, land, and building out rental communities. If you are selling a home, do everyone a favor and sell to a family rather than a big investor.
• For those currently living in a manufactured home community or looking to buy a home in one, the information on this site is invaluable and also provides an entire section on protecting residents and calls to action.
• As always – cash is king, bank with smaller local banks you have researched and interviewed, and consider who is controlling your portfolio and who you are investing in.
Own and be happy – rent and be happy – invest and be happy – but never take your eye off the ball.
Download this full report in The Bookshop >
Read the short follow-up article to this report: The Art of False Defeat in The Housing Market
This report was sponsored by The Solari Report.
Related Reading
University Migrant Smart Hubs, Private Equity and The Leveraged Buyout of America by Corey Lynn, Corey’s Digs
BIS Blueprint = Global Control of ALL Assets, Information & People by The Sharp Edge – Corey’s Digs
Financial Takeover & Your Bank Account – BlackRock, Envestnet/Yodlee, and The Federal Reserve by Corey Lynn, Corey’s Digs
An Editorial Comment on Private Equity by Catherine Austin Fitts, The Solari Report
Plunder: Private Equity’s Plan to Pillage America by Brendan Ballou
These Are The Plunderers: How Private Equity Runs – and Wrecks – America by Gretchen Morgenson and Joshua Rosner

Subscribe to Corey’s Digs and don’t miss a Dig!
Corey Lynn
Corey Lynn is an investigative journalist, co-host of the weekly Dig It! podcast, and co-host of The Solution Series. Follow her at coreysdigs.com, on Twitter, Gab, Truth, Rumble, and Telegram. Support her work by becoming a Patron, making a donation or buying a Book.


3 Comments
Gerry_O'C
…it’s a great report Corey! well done, and it ought to be thoroughly appreciated by all who are directly and diligently affected by these issues, there are encouraging facets, assuming that i understood correctly, in that a high proportion of folk ‘own’ their housing properties, it’s more than i expected considering the times we live in…i must admit i’m not knowledgeable enough in this field to intelligently comment…that had self-consciously prevented me doing so on others of your articles before!…actually, NO it most certainly hadn’t!!!…i tried to explain some of the material on at least one of your articles on the food system and the fact that six or is it up to ten companies are positioned so that they may exert their comprehensive control, and whatever my explanation may had lacked in terms of emphasis on it’s clarity and urgency, i discover that there is ostensibly ‘a virus equivalent’ out there in terms of pervasive and insidious cognitive dissonance, or indifference that renders attempts at such conversations redundant, even though at least one case in point concerned a land owner…i like the pattern that seems to adapt to your reports, it reminds me of what i’ve observed from my limited knowledge of the game of ‘Go’, in that on the basis of your broad layout and approach, all your points literally reflect on one another, while retaining the concept of a homogeneous whole, each area may be considered on the merits of it’s apparent separate basis, and they are intense, yet, you develop the idea of their integral and influential to that overriding unity, and your reports that i’ve read, are not only informative and aesthetic to read, on that basis, but retain to them that quality of their utter and urgent transparency, that is encouraging me to unsubscribe from several sites or whatever…why not when your expression here is regularly the equivalent of (a) ‘The Master of Go’ … https://inverarity.livejournal.com/198398.html … and which imminent and immanent appeals are succinct in their deliveries while sacrificing nothing to their being simultaneously more than sufficiently expansive!…here’s’ a couple of other links including references to Henry Kissinger and Go, and the game ‘Diplomacy’ which it is believed was also an interest of JFK’s… https://medium.com/@_gelbart/thoughts-on-go-weiqi-78200bb01a62 … https://www.kiseidopublishing.com/Kissinger2.pdf… https://en.m.wikipedia.org/wiki/Diplomacy_(game) …again fantastic report Corey!…and i recently i have begun perceive the Internet for all of it’s positive values an increasingly and possibly lonely ‘space’!…🙏➕🙏…
Gerry_O'C
i did a substack on your report Corey ‘Space: The New Frontier for The Central Control Grid’, and i hope u find an opportunity to take a look sometime. i’m posting a link here rather than under the relevant article as this latest report of your’s is more current. i enjoyed writing it, apart from slight ‘screen fatigue’, just now, due to my hours of various and sundry spent recently on my device…here’s the link.. https://gerryoc.substack.com/p/lets-get-spaced-outthe-psychological?utm_source=post-email-title&publication_id=1958143&post_id=149657698&utm_campaign=email-post-title&isFreemail=false&r=1uo2p8&triedRedirect=true&utm_medium=email …and if it reads fifty percent of it’s intended i’ll be happy!…
johneightfortyfour
“One key factor in play is the financial control system that (((they))) are attempting to rollout, which could potentially assert control over people’s bank accounts in the future, how they spend their money and when they get access to their money. ”
FIFY