My Personal Experience with Covid-19 and Digging Up The Evidence, for Transparency
As an investigative journalist, I have written numerous reports on Covid-19, including information from inside the hospitals, tying together data points, the science, big pharma, funding, therapeutics and vaccines, and the impact it has had on our economy to the detriment of the people. In addition to hundreds of hours of research, analysis, and first-hand observations, I have had personal experiences and connected with many in the medical field. Because I have published so many reports regarding Covid-19, for transparency purposes, I want to share how I have arrived at my conclusions, as well as gathered the evidence to back my reports. Early on, when Covid-19 first hit the U.S., I was already observing false flags, viral video propaganda, and bad actors warning people that 1-2 million people would die. I’ve seen this show before. I’ve observed it, researched it, and in some cases lived through it. They come on…
COVID-19 Pt. 3: Nursing Homes and Long Term Care Facility Deaths “With” OR “From” Covid Facts
It has consistently been reported that nursing homes and long-term care facilities account for 40% of all Covid-related deaths, but how do these numbers actually breakdown? Is the general population aware that they are including these deaths in the total mortality data if they test positive but it’s not the cause of death, as Dr. Deborah Birx from the White House Covid-19 Task Force has stated, and as the CDC disclosed? Hospitalization data has also been distorted and is incredibly misleading, which was covered in part 1 of this report, including the fact that the 2017-2018 flu season far exceeded Covid hospitalizations, and the CDC is grouping pneumonia, influenza, and covid (PIC) for death totals, which was covered in part 2 of this report. Both contain critical data points put out by the CDC and the Covid Tracking Project to understand the real numbers. Perhaps the worst part to all…
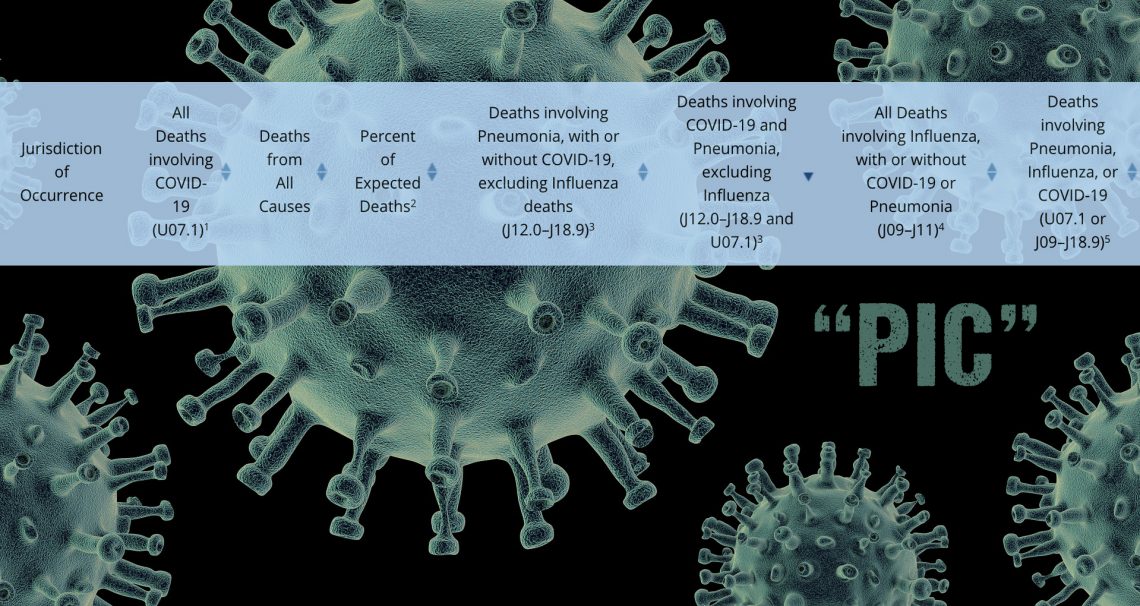
COVID-19 Pt. 2: CDC’s New “PIC” and The Hidden Data
In part 1 of this 5-part report on Covid-19, Corey’s Digs detailed a necessary reality check due to the media creating a frenzy over hospitalizations, despite the fact that the 2017-2018 flu season was hit with 810,000 hospitalizations, far more than Covid, and no one heard a peep about it. There were no lockdowns, restrictions, hyperbole, or mandatory masks, and 61,000 people died that season. Most people aren’t aware that the CDC has lumped influenza together with Covid and pneumonia in death rates with a new name called “PIC.” This comes after the CDC confirmed that only 6% of Covid-related death certificates indicate Covid as the only cause, while 94% list other illnesses as the cause with an average of 2.6 comorbidities. In other words, if someone was in the hospital dying of heart disease and they tested everyone for Covid to separate them to other rooms or wings, Covid…
COVID-19 Pt. 1: Hospitalizations – Reality Check
Televisions, computers, radios, and cell phones are blowing up with the media sounding the alarm: “hospitals are reaching full capacity!” while governors slide back into their authoritarian lockdowns. Back in March we heard the same panic-stricken message and were flooded with images of people lined up to get into hospitals, shortages of beds and ventilators, freezer trucks lining the alleys, graves being dug, and hospital ships swimming their way to the coasts of New York and California. Yet, by April 21, the Comfort ship was leaving the port from New York because Governor Cuomo said he didn’t need it. Corey’s Digs reported on Inside The Hospitals & Why The Lockdown back in April to show the reality of the situation at that time, and now we have nearly 10 months of data accumulated, and it paints quite a picture. A Dose of Reality: Don’t Let The Numbers Fool You…
PA Election Analysis: HUGE Anomalies & Indisputable Data
Joe Biden had said that he would wait until all states certified votes, but instead claimed the title President-Elect with the green light from the “media” while votes were still being counted. While the world holds its breath over election shenanigans, President Trump’s legal team is working overtime, filing suits, gathering affidavits, speaking with whistleblowers, calling voters who may not have voted, pulling obituaries, and exposing the voter fraud to the American people. Simultaneously, multiple people are also breaking down the statistics, data points, and revealing the patterns of election fraud, whereby likely millions of votes were flipped from Trump to Biden through a multi-layered combination of hardware, software, algorithms, and firmware generally known as the Hammer, Scorecard, Dominion and other transfer points. The analysis below represents data points that Corey’s Digs has been working on to show how this all adds up, how the probabilities are impossible, and how…


